By Adam Pagnucco.
This year’s election cycle is the first one in which public financing is being used in MoCo’s county-level races. That is one of many reasons why this election is historic in nature. So far, we know the following things about public financing: it is heavily used (especially in the Council At-Large race), it is administratively challenging, it requires a long time to raise money, it is less costly than first thought and while it creates opportunities for new candidates, it confers huge benefits on incumbents. Also, as predicted, the system reduces the influence of corporate interests and PACs. But who is stepping into that vacuum?
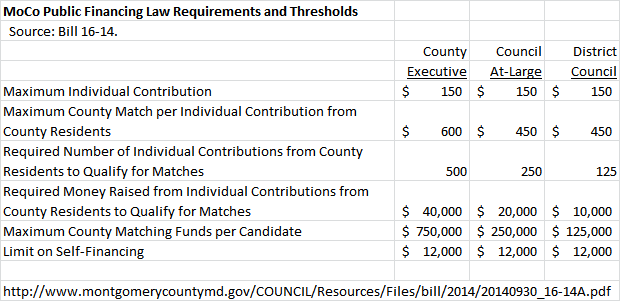
This week, we will explore where contributions to publicly financed candidates come from. Participation in the system is optional; candidates can stay in the traditional system and many of them have done so. Candidates in the public system may only accept contributions from individuals up to $150. They cannot take money from corporate entities or PACs and must limit self-financing to $12,000. Contributions from in-county residents are matched by the county on a sliding scale. For Executive candidates, a $150 in-county contribution gets a county match of $600. For council candidates, a $150 in-county contribution gets a county match of $450. Candidates must meet thresholds of in-county money raised and numbers of in-county contributors to qualify for matching funds and are subject to caps of public fund receipts. And if a candidate applies for matching funds and does not meet the thresholds, that person can be ruled ineligible for matching funds.
To examine the origins of contributions in public financing, we accumulated the contribution records of thirteen candidates who have qualified for matching funds: County Executive candidates Marc Elrich, Rose Krasnow and George Leventhal and Council At-Large candidates Gabe Albornoz, Bill Conway, Hoan Dang, Evan Glass, Seth Grimes, Will Jawando, Danielle Meitiv, Hans Riemer, Mohammad Siddique and Chris Wilhelm. We did not include contributions to district-level candidates like Sidney Katz, Nancy Navarro and Reggie Oldak because their receipts will inevitably be skewed to their districts, thereby introducing a geographic bias into the data. We also did not include contributions to non-qualifiers because they may not ultimately receive matching funds. One important consideration with examining these accounts is that not all of them have last filed on the same dates. While some were current as of the last regular report in January, others have filed as recently as last week. That’s because once a candidate qualifies for matching funds, they can apply for new distributions at any time through fifteen days after the general election. One important constraint for late starters: candidates in the system must qualify for matching funds by 45 days before the primary. Since the date of this year’s primary is June 26, that means the qualifying period ends on May 12.
This analysis involved an examination of nearly 9,000 records. We asked two sets of questions. First, where are in-county contributions eligible for matching funds coming from and how do they compare with both the population and regular Democratic voters? Second, what are the differences in contribution geography between participating candidates? Those differences contain illuminating clues to the appeal and strategy of the candidates which could ultimately decide the election.
We will begin unveiling our results in Part Two.

