By Adam Pagnucco.
In a year that was expected to be good for Republicans, Democrats picked up seats in both the Maryland Senate and the House of Delegates. Maryland Matters reports that Democrats will possess 34 of 47 Senate seats and 102 of 141 House seats, giving incoming Governor Wes Moore big majorities in both chambers. That’s obviously good for Democrats, but how does it rank historically?
Let’s start with the Senate. The table below shows the number of Senate seats won by Democrats and Republicans in every election since 1986.
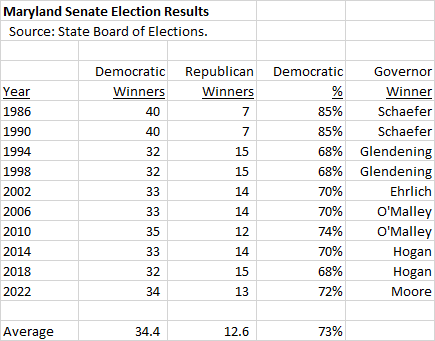
Senate Democrats were at the height of their power in 1986 and 1990, when they controlled 40 seats (85% of the total). That helped make Governor William Donald Schaefer one of the most powerful governors in Maryland history. Since that time, Democrats have held between 32 and 35 seats and Republicans have held between 12 and 15 seats. The 34-13 Democratic margin in next year’s Senate is average in recent history.
Why is the party balance so stable? Many senators are former delegates and therefore have significant histories in their districts. (In Montgomery County, all eight senators whose districts are fully inside the county are former delegates.) Senators also tend to raise more money than delegates, possibly making them harder to defeat. Lots of them face little competition as a result. One exception this year was District 18’s Jeff Waldstreicher, who crushed a decent primary challenger by 28 points.
Now to the House of Delegates. The table below shows the number of House seats won by Democrats and Republicans in every election since 1986.
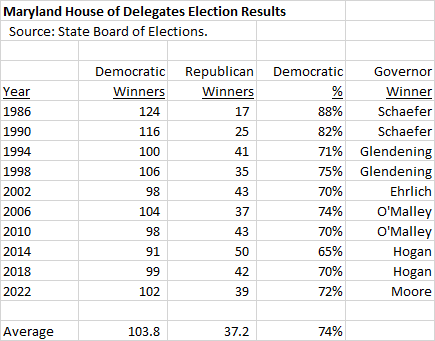
There is more variation in partisan balance in the House than there is in the Senate. Democrats have varied between 91 seats in 2014 (when Governor Larry Hogan was first elected) and 124 seats in 1986 (when Schaefer was first elected governor). The 102-39 margin in next year’s House is close to the average for the period.
Now here is a curious fact. Since 1986, here is the average number of Democratic House seats by the party status of the governor and the president.
Years in which the governor winner is a Democrat: 107
Years in which the governor winner is a Republican: 96
Years in which the president is a Democrat: 99
Years in which the president is a Republican: 108
Democratic seats in the House are positively correlated with a Democratic governor. However, they are negatively correlated with a Democratic president. Driving the latter negative correlation is that Democratic seats were highest when Ronald Reagan and George Bush (41) were president and lowest during Barack Obama’s second term. That said, there are only 10 elections in the data set, so small sample size may be driving these results.
In any event, this year’s General Assembly elections returned the Democrats to historically average majorities. I suspect Wes Moore will be content with that, and so too will be the General Assembly’s leadership.