By Adam Pagnucco.
Council Member Hans Riemer was never going to win this race for the reasons I outlined in Part Three. But he did get 28,193 votes, which were waaaaaaay more than enough to impact an election that was decided by 32 votes. Many people who watched or played in this race have asked whether he spoiled it for David Blair. Did he?
There are two schools of thought when it comes to Riemer. One school holds that there are only so many votes to go around for a challenger running against an incumbent, so if there are multiple challengers, they will split those votes and enable the incumbent to win. An example of this is County Executive Ike Leggett’s 2014 victory over Doug Duncan and Phil Andrews in which he received 46% of the vote.
The other school of thought looks at the similarities between Riemer and the incumbent, Marc Elrich. Both are Downcounty politicians who live within a bicycle ride of each other. Both have electoral bases in Downtown Silver Spring and Takoma Park. Both play on the progressive side of county politics. Both have served for over a decade in county government. Neither of them is an outsider like Blair. If anything, Riemer could have spoiled the election for Elrich.
Some of these arguments are untestable. In fact, Riemer tried to differentiate himself from both Elrich and Blair, attacking each of them throughout the cycle. He did not see himself as a spoiler for anyone – he was trying to win.
But there is one tool that can provide insight – the precinct results we analyzed in Part Six. Let’s start applying them to Riemer. The chart below shows Riemer’s percentage of the vote by region and local area. Bars in red show areas won by Elrich and bars in blue shows areas won by Blair. He finished third in every area except Takoma Park, where he finished second behind Elrich.

As we saw in Part Six, Elrich pulled his biggest net margins from Silver Spring Downtown and Takoma Park. Those were Riemer’s two best areas as measured by his vote percentage. Blair’s biggest net margins came from Potomac, Gaithersburg and Bethesda. Riemer’s vote percentages in Potomac and Gaithersburg were below his average, while his performance in Bethesda was very close to his average. So there is more support in this cut for the view that Riemer was a bigger problem for Elrich than Blair.
Now let’s construct two scatter charts comparing Riemer’s precinct vote percentages to Elrich and Blair. The chart below shows Riemer’s percentage (on the horizontal axis) and Elrich’s percentage (on the vertical axis) in each of the 250 precincts that cast at least 20 votes for county executive. Each green dot represents one precinct. The line of best fit (in red) shows the trend in relationship between the two.

See how the line of best fit rises? That indicates a slight tendency of Riemer’s vote percentage to rise along with Elrich’s, with of course many other factors in the mix. The correlation coefficient of the two is +0.19, a weak positive relationship.
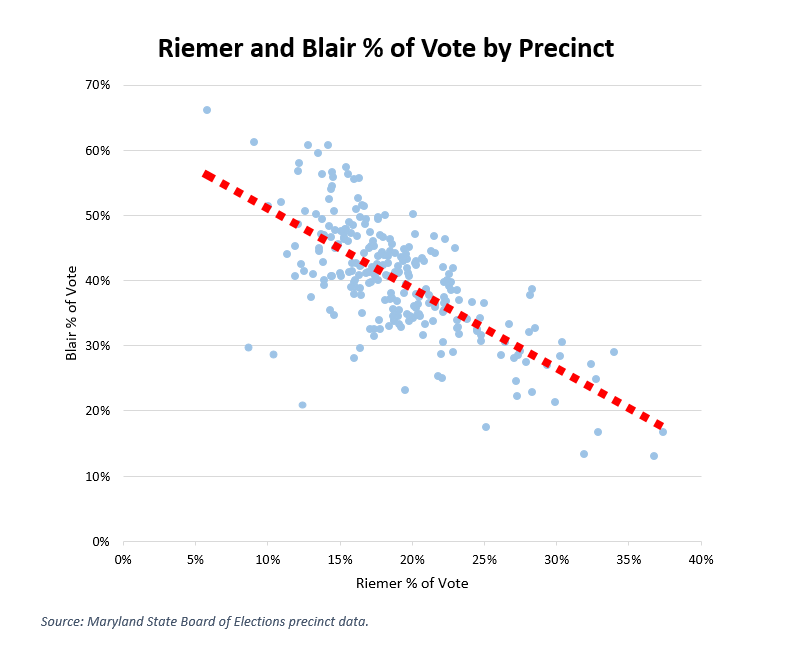
The chart below compares Riemer’s precinct results to Blair. Each dot represents one precinct, with Riemer’s percentage on the horizontal axis and Blair’s percentage on the vertical axis. The line of best fit (in red) shows the trend in relationship between the two.

This time, the line of best fit is a steep decline. The correlation coefficient of Riemer’s vote percentage and Blair’s vote percentage is -0.69, a substantial negative relationship.
The evidence above suggests that Riemer’s geography overlapped more with Elrich than Blair. But there are other questions that remain unanswered, including:
Were Riemer’s attacks on Blair more effective than his attacks on Elrich? Or was it the other way around? Or was it a wash?
Did Riemer win undecided voters in the final month that would otherwise have gone to Blair?
If Peter James was not in the race, who would his voters have supported? Would they have voted at all?
We will never be able to answer the above questions. But from this analysis, the allegation that Riemer spoiled the election for Blair does not seem persuasive.
