By Adam Pagnucco.
Previously, we looked at the geography of property crime in MoCo. Today, let’s look at demographics.
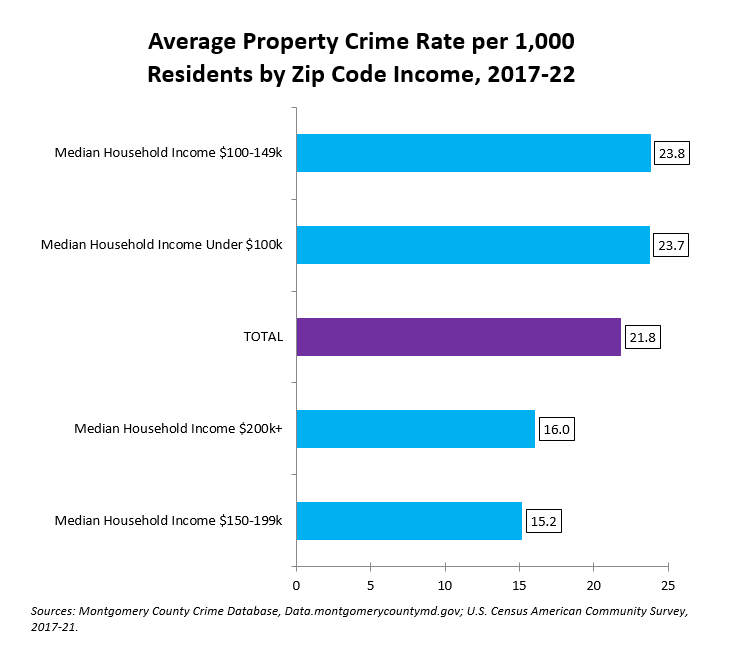
To assess demographics, we looked at zip code population data from the Census Bureau’s 2017-21 American Community Survey. First, let’s examine violent crime rates by zip code median household income.

As with violent crime, property crime rates tend to be higher in lower-income zip codes. However, the relationship is not linear and is weaker than with violent crime. For example, the property crime rate in Potomac (11.5 per 1,000 residents) is much lower than in Bethesda (23.6) and Chevy Chase (21.5) even though all are high-income communities.
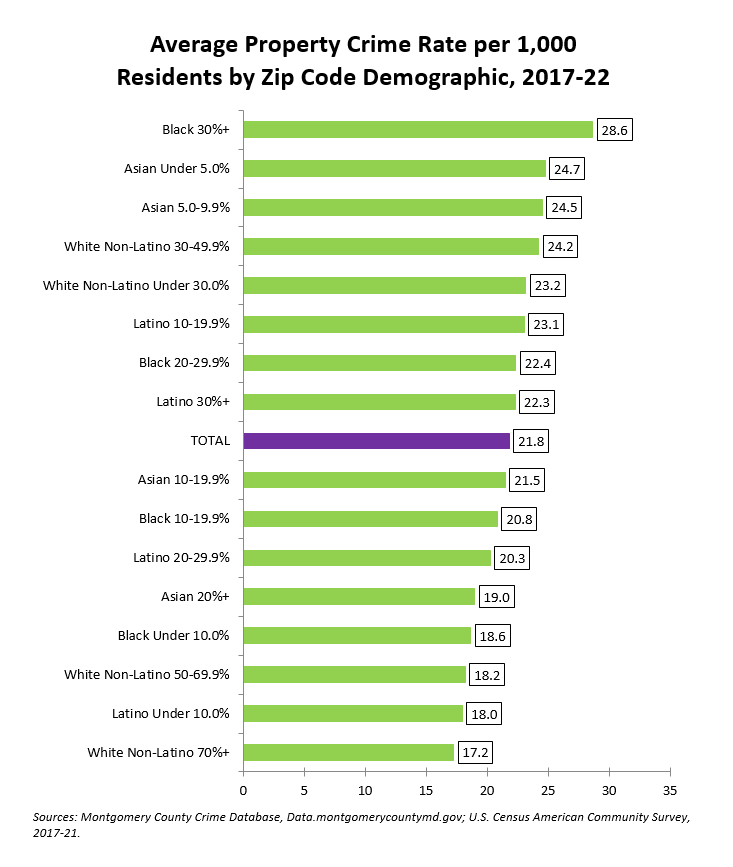
Now let’s look at population percentage by zip code of the four major racial groups: Asians, Blacks, Latinos and White Non-Latinos.

As with violent crime, zip codes with high percentages of Black and Latino residents have higher rates of property crime than heavily White zip codes. But again, the relationship is much weaker than with violent crime. For example, Bethesda and Potomac are both majority-White but they have very different property crime rates.
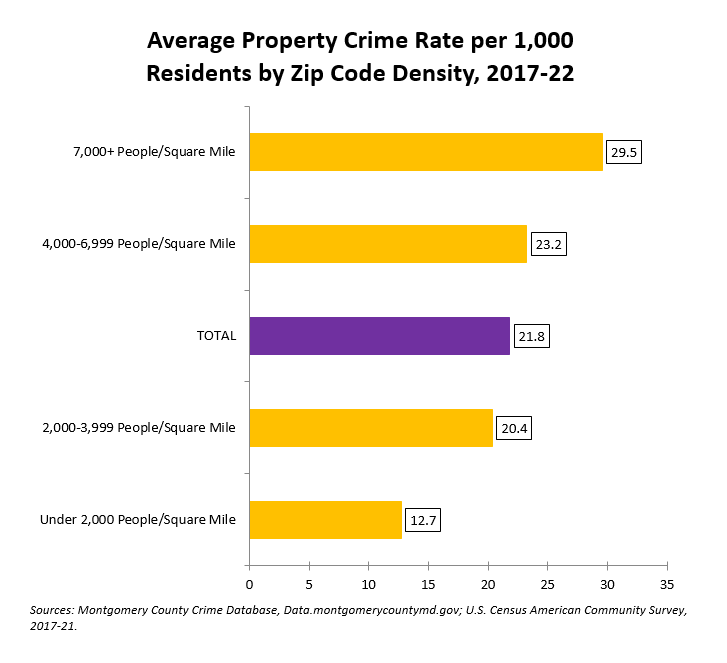
Finally, let’s examine population density.

Very dense areas have more than twice the property crime rates of sparsely populated areas. This data is heavily influenced by zip code 20910 (Downtown Silver Spring), which had a property crime rate for the six-year period of 45.3 – the highest rate of any MoCo zip code. On the other end of the spectrum were the zip codes for Brookeville, Poolesville, Barnesville, Boyds, Ashton and Washington Grove, all of which had property crime rates of below 10 per thousand residents.
Income and racial correlations for property crime were present but weaker than for violent crime. Population density was more relevant, at least at the extremes. Once again, if the county wants to encourage dense, downtown transit-oriented development, it needs to supply police service at levels sufficient to deal with property crime to sustain it.
We are not done. There will be more to come!
