By Adam Pagnucco.
In our prior post, we saw how our population growth has stalled – a trend that has also impacted D.C. and parts of Northern Virginia. Now let’s look at gross domestic product (GDP).
The U.S. Bureau of Economic Analysis, the source of data for this series, defines GDP as “The market value of goods and services produced by labor and property in the United States, regardless of nationality.” In effect, this is the broadest definition of the size of our economy – and also our tax base.
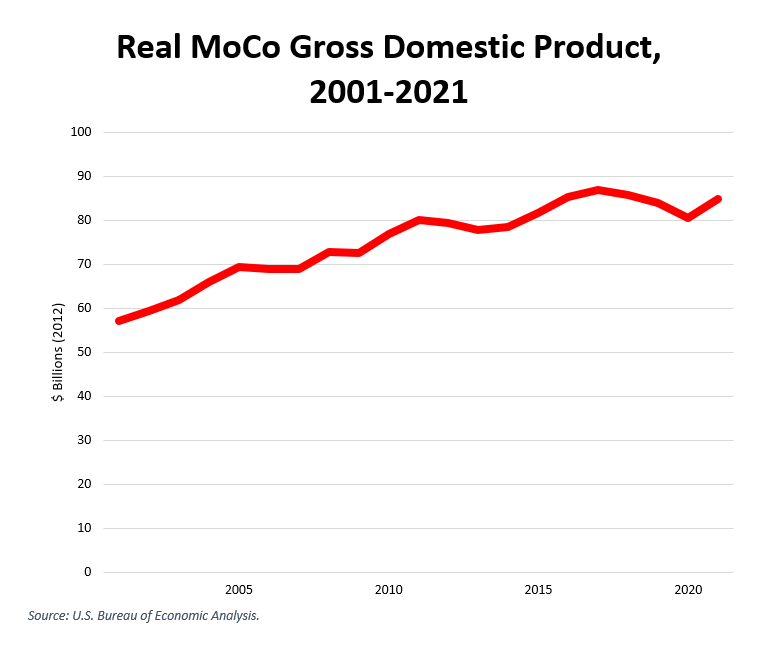
The chart below shows our county’s GDP in real (2012) dollars from 2001 through 2021. The trend is generally up with pauses during recessions. In 2021, our GDP was $84.8 billion in 2012 dollars, slightly below 2017 ($86.8 billion). We can blame part of that on the pandemic, but GDP dropped in both 2018 and 2019 – the two years preceding COVID.
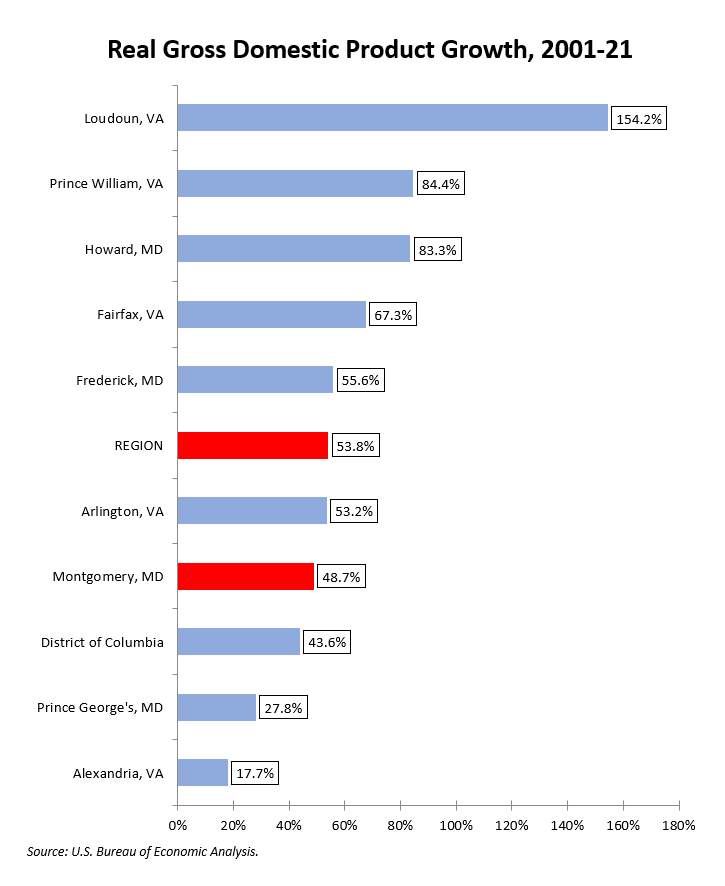
The chart below shows GDP growth over the last 20 years. We were close to the regional average and we had more growth than D.C., Prince George’s and Alexandria.
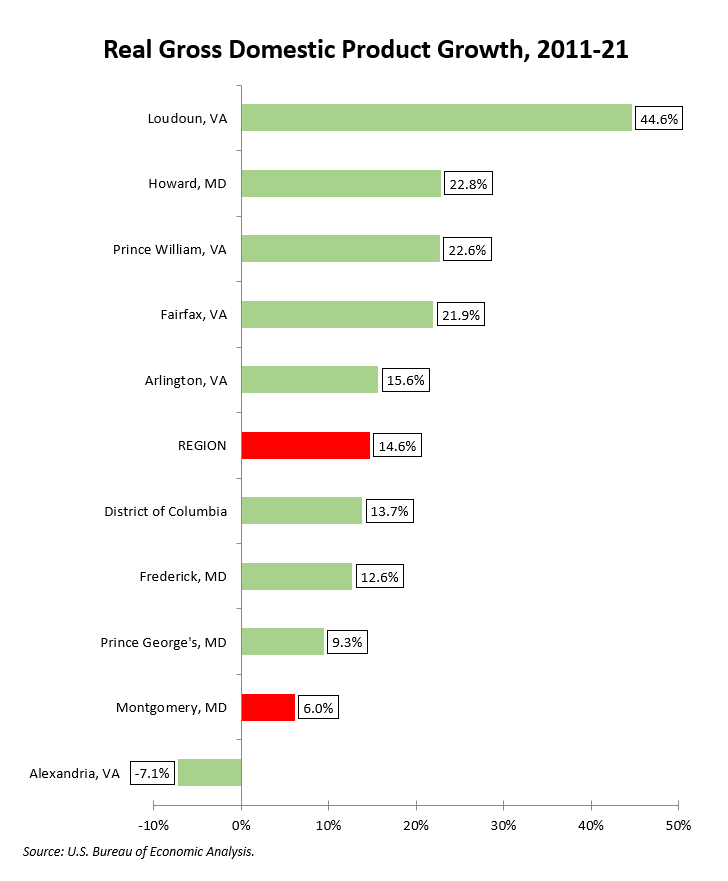
Now let’s look at the last decade. We grew at less than half of the regional average. Of the big jurisdictions, only Alexandria fared worse.
Now to 2017-21. Alexandria and our county shrank. The other big jurisdictions all grew. Let’s remember that the last two years of this period were in the pandemic.

Folks, our economy is falling behind the rest of the region. If this continues to be the case, it will constrain every choice we make in budget, taxes and legislation. We don’t have a lot of room for error in our policy decisions.
Next, we will look at GDP per capita.