By Adam Pagnucco.
Last week, the county government alleged that U.S. Census Bureau data on building permits was inaccurate. In our case, the county’s failure to report its data to Census probably contributes to the problem. Since I wrote about it last, I have heard about issues with this data series in other jurisdictions, often because of faulty or absent self-reporting. As a result, I am now quite skeptical of Census building permit data in general.
But the issue of housing remains. Our housing market is characterized by tight supply and rising prices. That raises the question of whether supply is keeping up with demand, both in Montgomery County and across the Washington region. If Census building permits data is inaccurate, how can we measure housing construction?
To answer that, I turned to one of the most rigorous statistical endeavors in the world: the decennial census. To accomplish this constitutionally enshrined survey, the Census Bureau hires hundreds of thousands of people and sends them door to door to collect vast amounts of data. In 2020, the Census Bureau spent $14.2 billion on that year’s decennial census. This is very different from any survey of building permit offices, some of whom do not report and others who may make methodological mistakes.
One of the tables produced by the decennial census is H1 (Occupancy Status of Housing). This is a count of housing units. This statistic bypasses one issue with building permits, which is the status of teardowns. Because teardowns involve the removal of old units and their replacement by new units, they are not net additions to housing stock. Teardowns are not insignificant in MoCo homebuilding. In a debate about proposed legislation on teardowns, it was revealed that our county had more than 2,000 demolition permits for single family homes from 2010 through 2019. Looking at changes in the number of units gets to net change rather than gross change.
The chart below shows growth in the number of housing units by major Washington jurisdiction from 2000 through 2010.

Montgomery County was one of the slower growing large jurisdictions during this period although we grew faster than D.C. and Prince George’s.
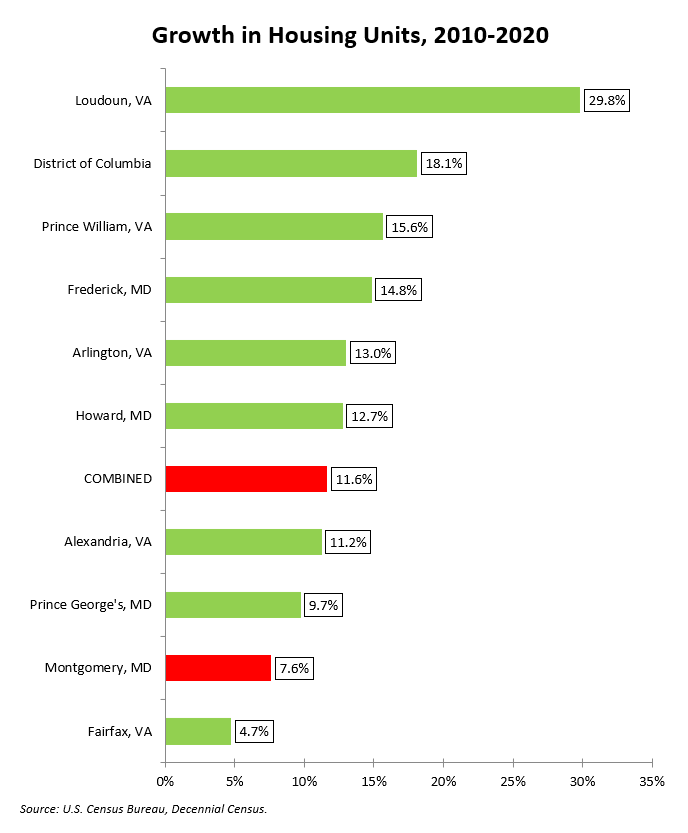
Now let’s look at growth in the number of housing units from 2010 through 2020.

Once again, we fell short of the growth in most large jurisdictions. Only Fairfax grew slower than we did.
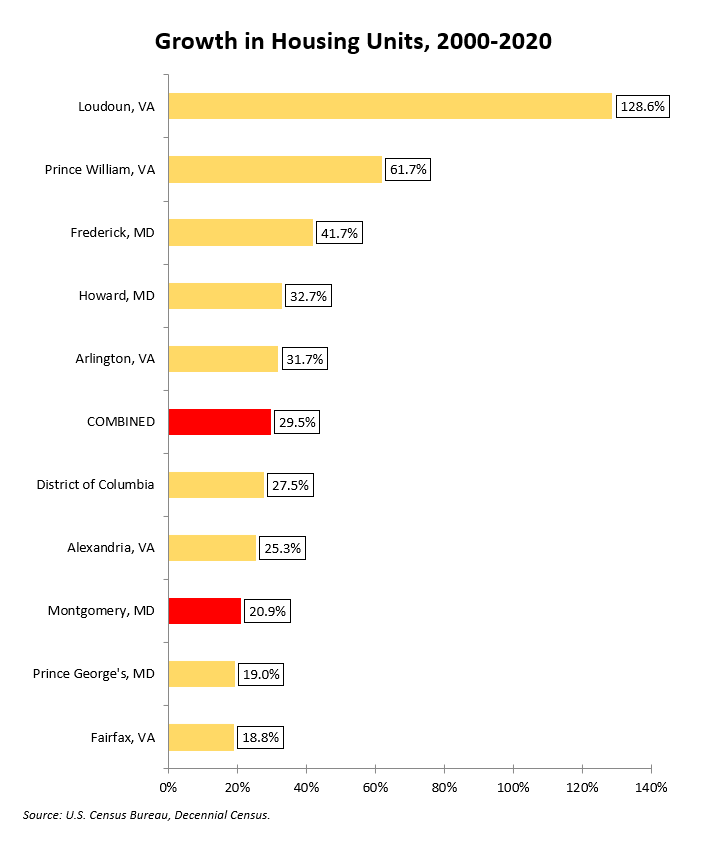
This chart looks at the entire twenty-year period.

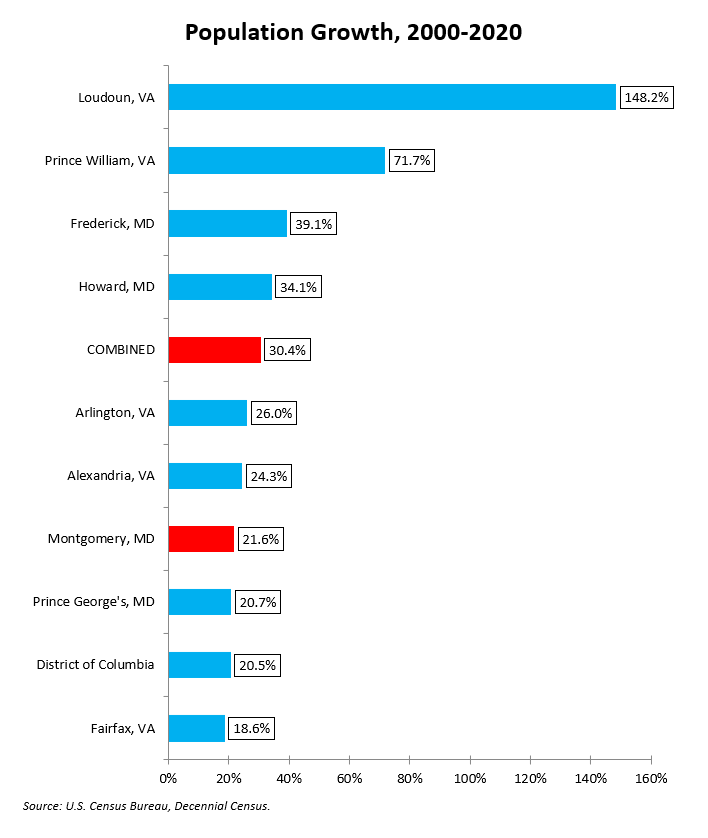
Now let’s include some context. For the most part, the slower growing jurisdictions tend to be the largest ones. It’s hard to grow at a high rate from a large base. What’s also relevant is population growth, which helps define demand in the housing market. The chart below shows population growth from 2000 through 2020, also from the decennial census.

So our housing stock was growing slowly compared to the rest of the region but so was our population.
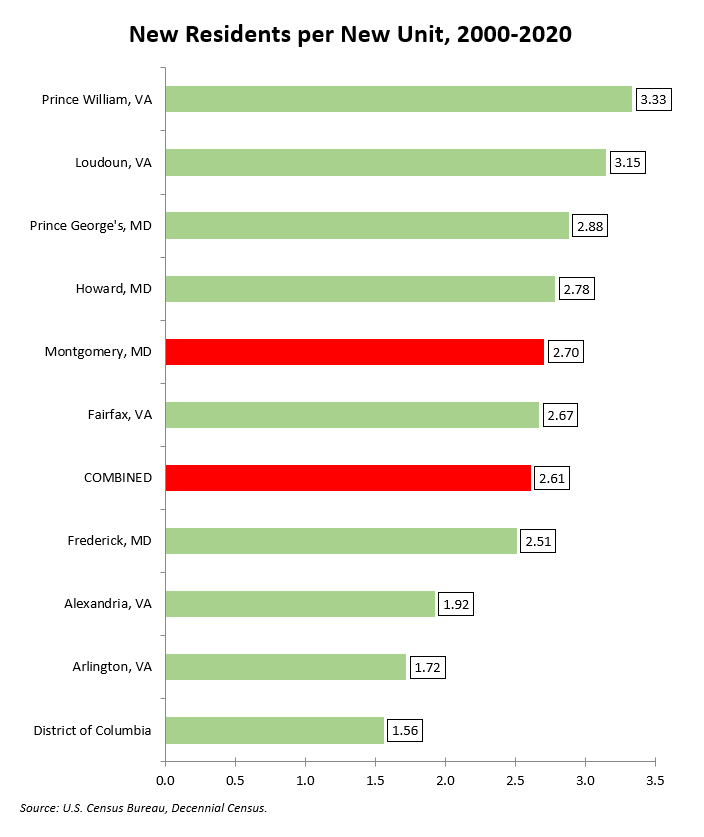
Finally, let’s compare the growth in residents to the growth in housing units. On average, the Washington region has 2.5 residents for every housing unit. If a jurisdiction is adding more residents than that per new unit, its housing market is probably tightening. If it is adding less, its housing market may be loosening a bit. The chart below shows this statistic by large jurisdiction from 2000 to 2020.

Montgomery County is close to the regional average. That means, compared to the region, our long term growth in housing reflects our population growth. The outliers are Loudoun and Prince William counties, two rapidly growing jurisdictions who have been struggling to keep up with housing demand.
The story here is that we have been building more housing units over the last twenty years but probably not enough of them to change the balance of supply and demand. Right now, limited supply is contributing to rising home prices and perhaps rising rents too. If we want to make a dent in the price of housing, we need a much greater volume of home building. Above all, we must avoid doing anything to deter housing construction such as more tax hikes on real estate and – especially – instituting rent control.
