By Adam Pagnucco.
One of the biggest economic stories in the Washington region right now is the end of high local inflation rates. That’s good news for area residents. It also has significant implications for Montgomery County’s rental market.
First, let’s look at regional inflation in broad historical terms. The chart below shows the 12-month change in the Washington-Arlington-Alexandria CPI-U since 1915. This is a different measure than annual change because the U.S. Bureau of Labor Statistics (BLS) has been releasing regional CPI-Us in six of each year’s twelve months since 1977 with less regular reporting in prior years. This measure is more sensitive to inflation spikes and troughs than annual averages.
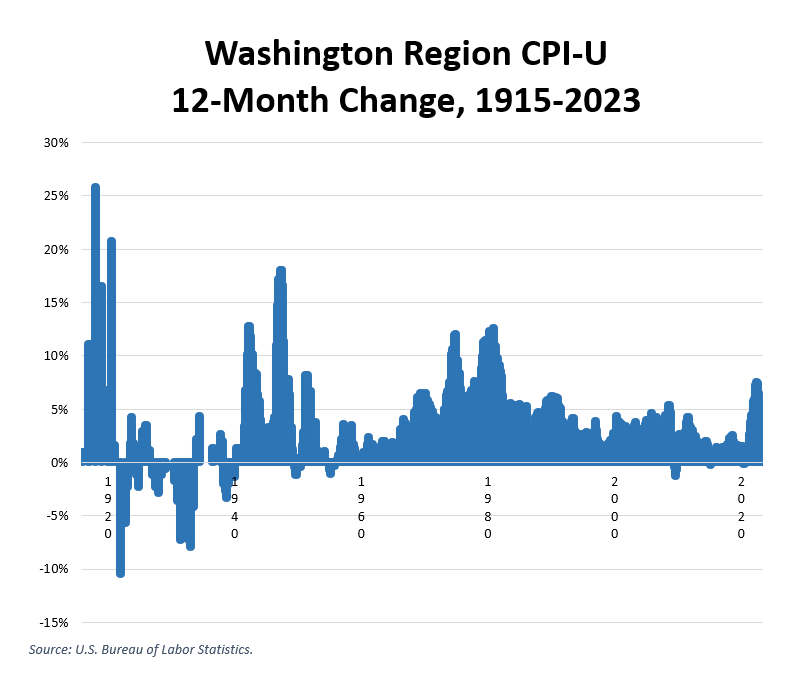
The inflation we have just experienced is historically unusual. The post-COVID price spike culminating in a 7.5% increase in the year ending in May 2022 was the largest since 1982. While recent inflation was less than it was during World War I, World War II and its aftermath, the 1970s oil shocks and early 1980s stagflation, it tops anything seen in the last forty years.
That said, inflation appears to be winding down. Prices increased by 3.1% in the twelve months ending in May 2023. This is close to pre-pandemic levels and suggests that the Federal Reserve’s interest rate hikes have succeeded in curbing price growth.
This has direct implications for Montgomery County’s rental market.
First, let’s look at the Washington-Arlington-Alexandria CPI-U’s measure of rent of primary residence (series CUURS35ASEHA). The chart below shows both the rent CPI-U (left axis, in green) and its 12-month change (right axis, in red) from 2007 through 2023.
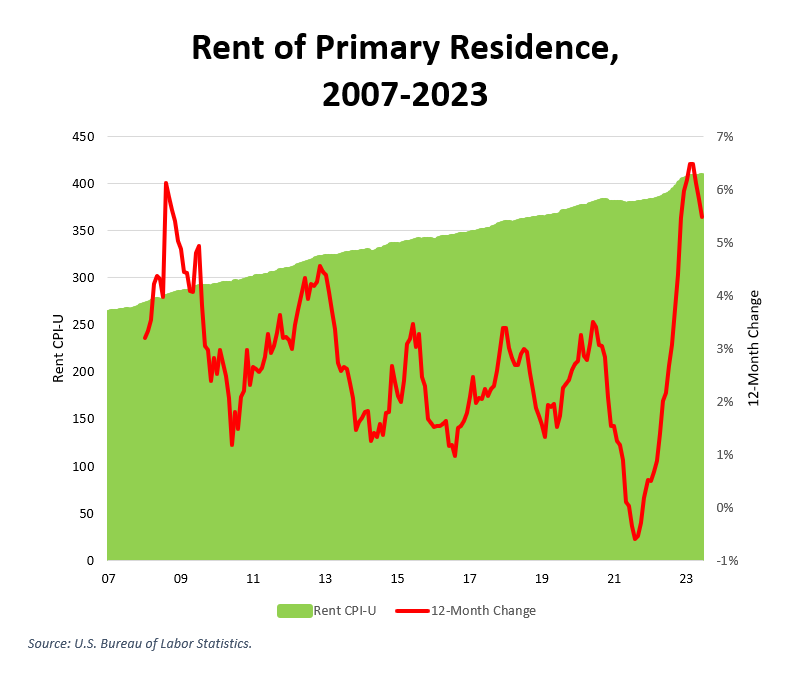
Rent increases across the region were generally modest since the Great Recession ended, typically varying between 1% and 4%. In the summer and fall of 2021, they were actually negative. They began rising afterwards and peaked at 6.5% in the year ending in February 2023, since declining to 5.5% in the year ending in June 2023. The rental component of the CPI-U rose 0.09% between March and June 2023.
At the moment, rents in the region have stabilized.
What explains the above pattern in rents? One factor is energy costs, an important component of owning and operating real estate. The chart below shows the regional CPI-U’s measure of household energy (series CUURS35ASAH21, left axis, in green) and its 12-month change (right axis, in red) from 2007 through 2023.
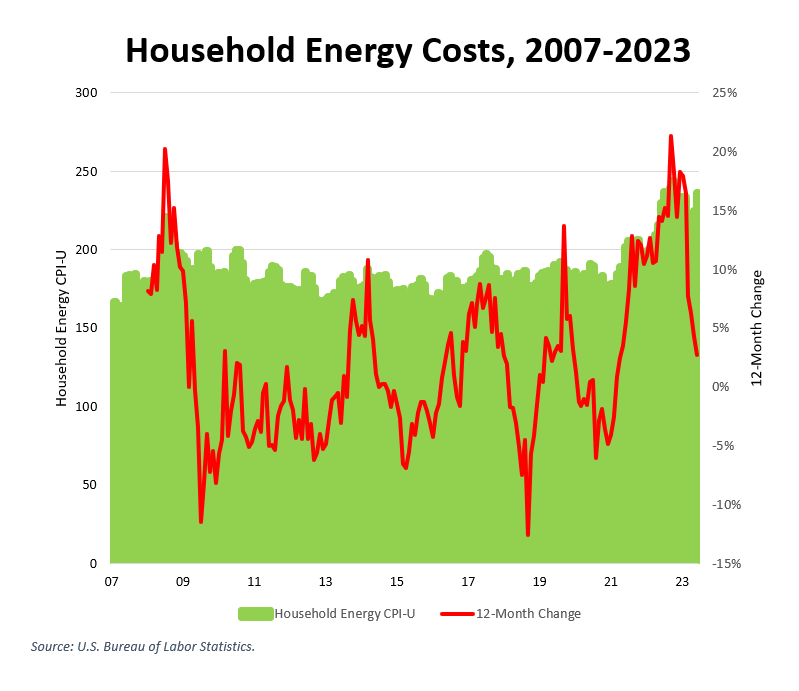
Household energy costs, like its base inputs (electricity, gas, oil and others) are extremely volatile, sometimes rising and sometimes falling. They spiked during the pandemic, peaking at a 21.3% increase in the year ending in September 2022. But they have since stabilized, only increasing by 2.7% in the year ending in June 2023.
Now let’s look at another cost of housing – the CPI-U component for household furnishings and operations (series CUURS35ASAH3). The chart below shows the household furnishings and operations CPI-U (left axis, in green) and its 12-month change (right axis, in red) from 2007 through 2023.
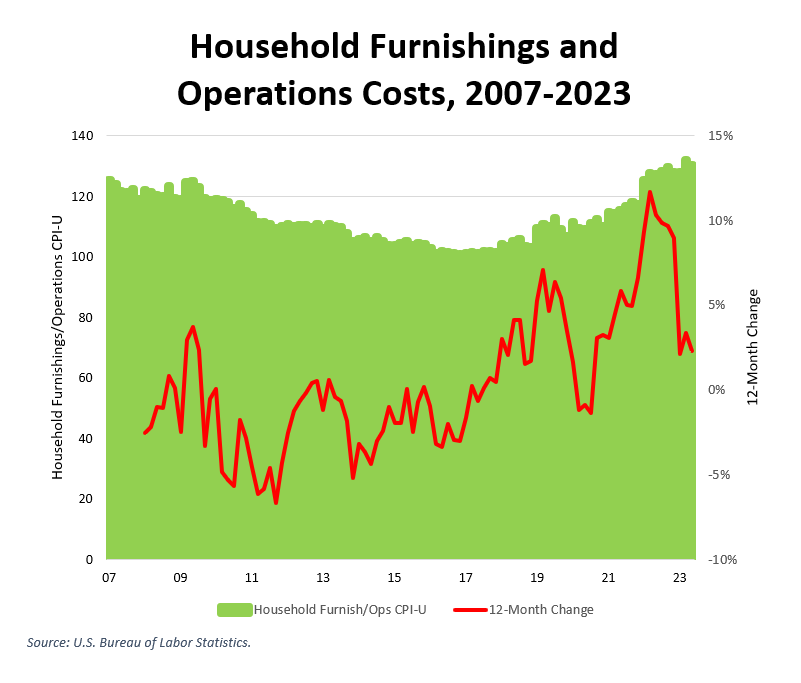
These costs were declining from the Great Recession through 2017. They increased a bit in 2019 and then spiked during the pandemic, peaking at an 11.7% increase in the year ending in March 2022. But like household energy, these costs have fallen off, increasing by just 2.3% in the year ending in May 2023.
Finally, there is financing. My real estate sources have grown increasingly worried about the consequences of rising interest rates and tight credit, a byproduct of inflation and the Federal Reserve’s campaign against it, for commercial real estate. Big banks are divided about how bad credit problems will become with some saying that the challenge is manageable and others predicting a crash for the commercial sector. Regardless, it’s a problem for developers and apartment building owners and is currently acting as a brake on housing supply.
A widely used measure of real estate financing, the 30-year fixed mortgage rate, began rising during the pandemic and is at its highest level since the Great Recession. That said, this particular measure peaked last November. It’s not clear whether it will rise significantly in coming months.
So let’s put all of this together. Rents in the region rose slowly for many years along with barely detectable inflation and low financing costs. The pandemic disturbed that equilibrium by causing spikes in the costs of energy, housing operations and real estate financing. At the same time, D.C., Montgomery County and Prince George’s County – which according to the U.S. Census Bureau together account for half of the region’s renters – implemented temporary rent ceilings. Eviction moratoriums were also established nationwide. So many landlords in the region were prevented from recouping these costs through rent hikes. Once the temporary rent ceilings and moratoriums were lifted, rents went up to recover these costs. But they went up by average rates of mid-single digits, not by double digits as rent control advocates frequently claim. And now that inflation and real estate operating costs have cooled, rents across the region have been flat since March.
This is a classic story of market economics: the interaction of global and regional economies, the balance of supply and demand and the usage of the price mechanism to achieve equilibrium. This has happened before – notably in the 1970s, when Montgomery County reacted with rent control that resulted in the conversion of thousands of rental units into condos. Once rent control was ended, housing construction resumed and rent increases went down. The lesson here is to work with the market, not against it, and if rents are rising, then do everything possible to help vulnerable tenants and encourage housing construction.
Instead of learning that lesson, today’s county leaders have repeated the mistakes of their predecessors. Now we will suffer the consequences.