By Adam Pagnucco.
Part One introduced the concept of depolicing, which Wikipedia defines as “a term for police disengaging from active police work, generally as a reaction to external scrutiny or negative publicity.” Crime stats are rife with problems and often unreliable, but the county’s comprehensive annual financial reports (CAFRs) provide three series that go back to the late 1990s. Is there evidence of depolicing in Montgomery County?
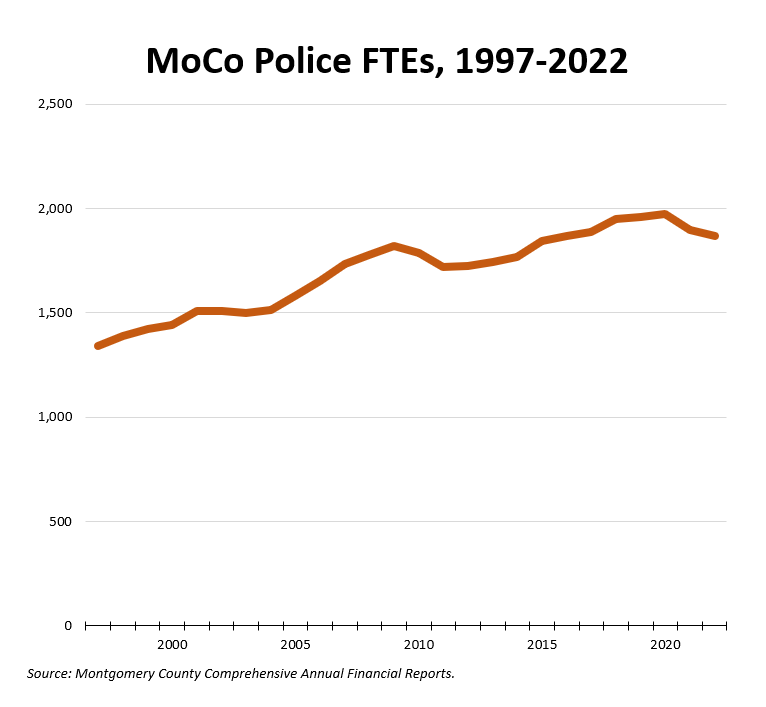
Let’s start with two items of context. First, the chart below shows county police department full-time equivalent (FTE) positions from 1997 through 2022. With the exception of dips during the Great Recession and the more recent defunding era, the trend here is generally upwards. Any changes in police activity numbers are probably not a reflection of declining positions. That said, the county does have issues with vacancies.

Second, the recent pandemic may have affected law enforcement activity. The exact relationship between COVID and crime trends is still being studied, but it’s plausible that COVID reduced in-person police contact with the public as well as in-person contact between people generally. The table below shows trends in different types of crime since 2017 from the county’s crime database.

Violent crime dipped slightly during the pandemic and then peaked in 2022. Property crime has been rising steadily for most of the period. Crimes against society are down substantially, which led me to question whether this reflects reduced police enforcement. In any event, we should closely watch whether developing trends start before or after the pandemic.
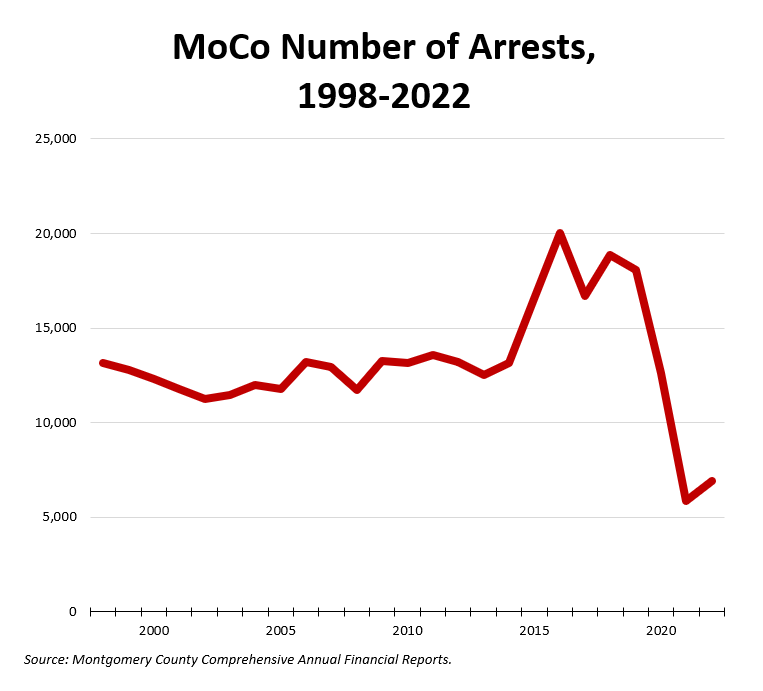
The chart below shows number of arrests from 1998 through 2022.

Arrests were steady from 1998 through 2014. They spiked in 2015-19 and plummeted thereafter. This decline coincides with the pandemic.
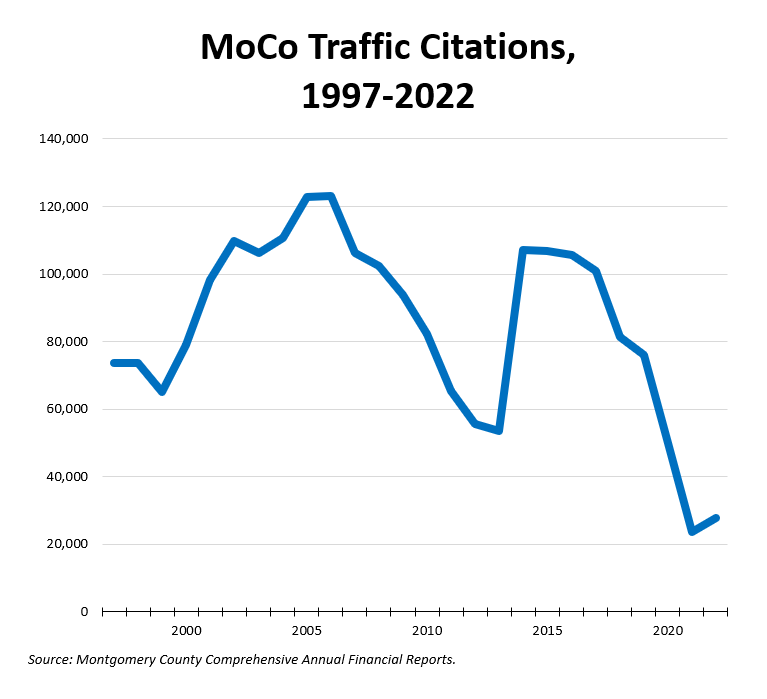
The chart below shows traffic citations from 1997 through 2022. This series excludes speed, redlight, and school bus cameras.

It may not be a coincidence that this stat rises when the economy is growing and collapsed during the Great Recession. Some of its variation could be due to raw traffic volume. The current decline began in 2018, predating the pandemic by two years, and hit bottom in the worst years of COVID. It’s probably not a coincidence that the pattern of citations resembles the pattern of declining driving under the influence crimes.
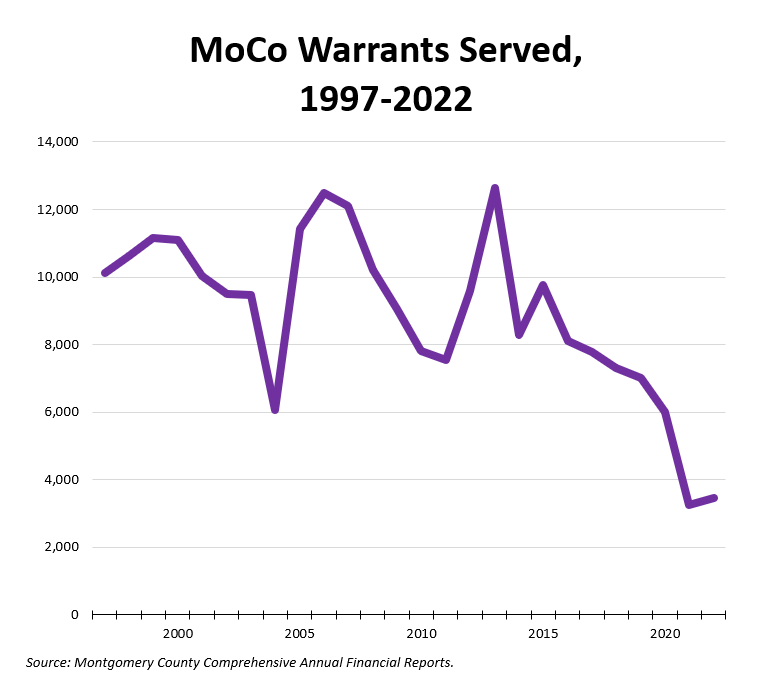
The chart below shows warrants served from 1997 through 2022.

This stat varies a lot, but like traffic citations, it began falling before COVID struck.
So what should we make of this data? COVID may be related to some of the historical variation in these series. But traffic citations and warrants began to fall before COVID and their timing appears to resemble the rise in sensitivity about police practices. This is not hard evidence of depolicing but it does raise questions.
In Part Three, we will begin looking at Montgomery County’s three largest municipal police departments.
