By Adam Pagnucco.
Part One introduced the premise of this series, which is a deep dive into demographics of primary voting in Congressional District 6. Now let’s cover two essential topics: voters and turnout by geography.
Where are the Voters?
This is the most basic question facing any CD6 campaign. In my first take on this race, I laid out where the voters were by county in the 2022 primary, the first election held under CD6’s most recent redesign. Now I will add in the district’s largest towns.
First, the Democrats. The pie charts below lay out the votes by county and large town. (Towns are defined by precinct locations.)
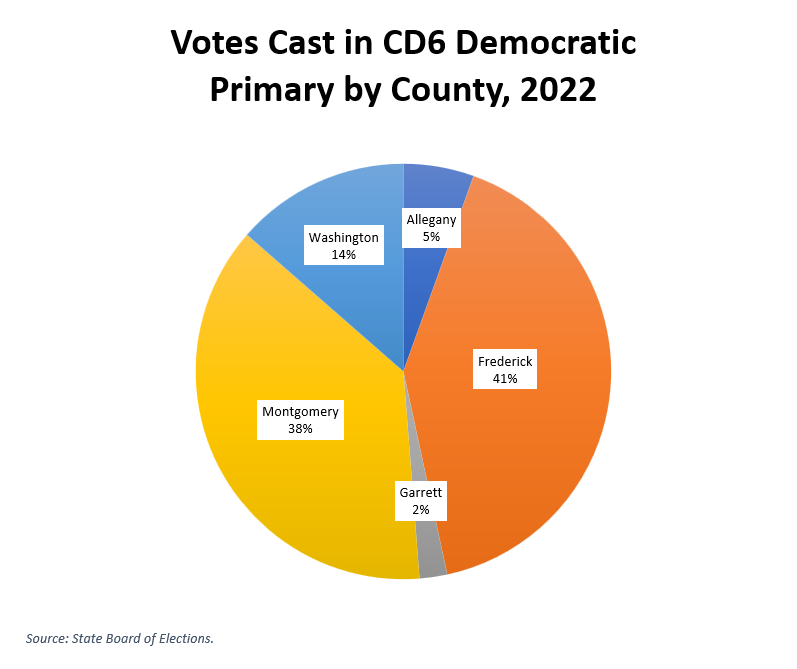
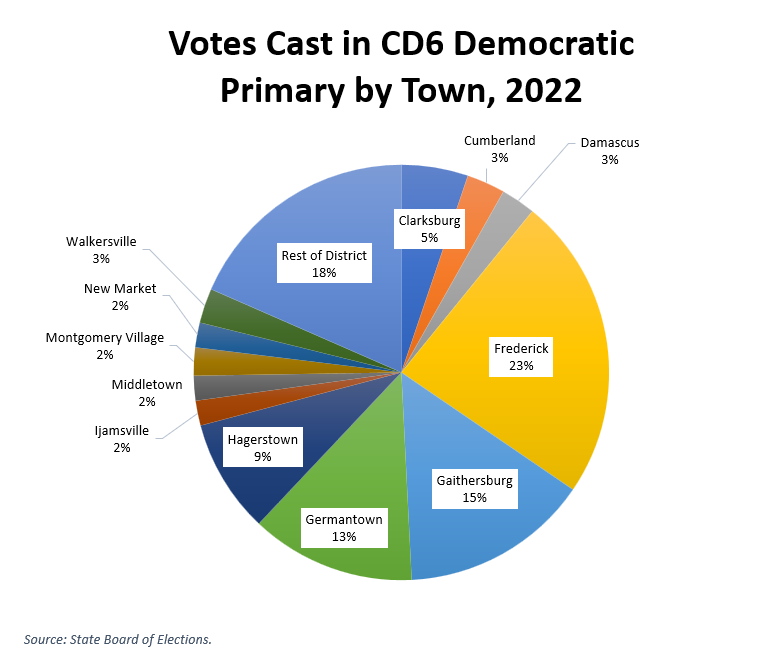
CD6 Democratic primary voters are a relatively concentrated group. 79% of them are in Frederick and Montgomery counties. A majority of them are in three towns – Frederick, Gaithersburg and Germantown. All three of them typically elect Democratic elected officials to state and county seats.
Now to the Republicans. The pie charts below lay out their votes by county and large town.
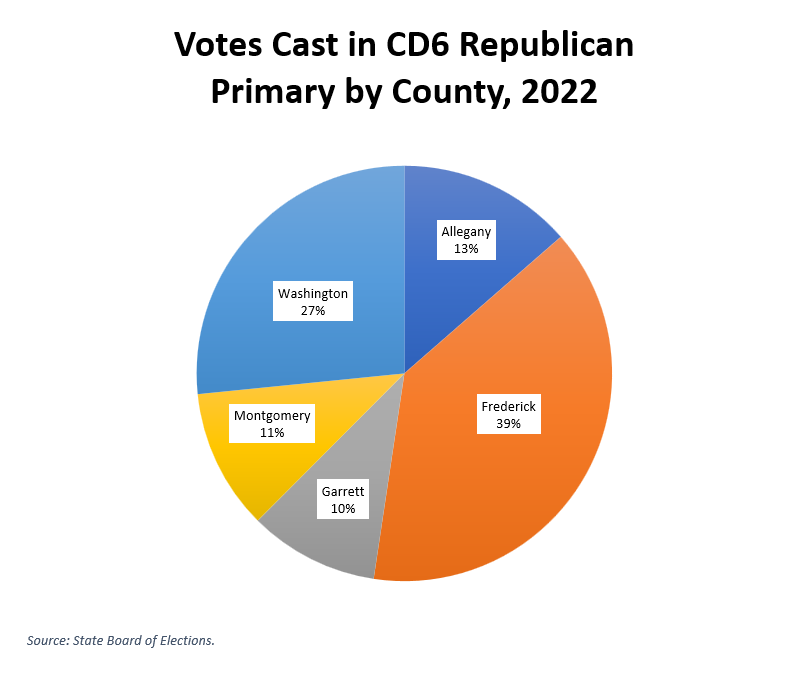
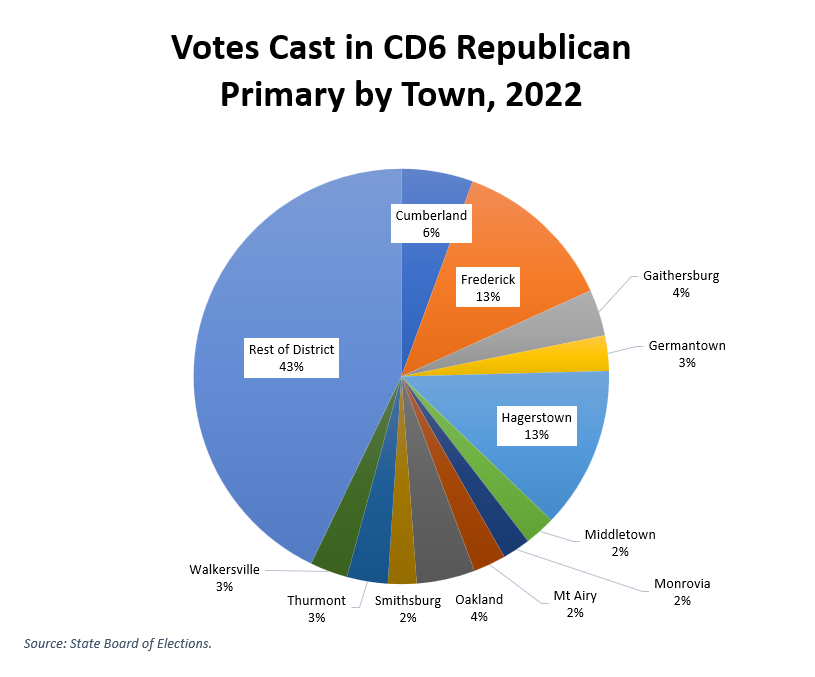
CD6 Republican primary voters are more spread out than the Democrats. Whereas a majority of the Dems are in three towns, it takes nine towns – Frederick, Hagerstown, Cumberland, Gaithersburg, Germantown, Oakland, Thurmont, Mt Airy and Smithsburg – to reach a GOP majority. A whopping 43% of Republican primary voters do not live in their top 12 voting towns. This geography is more challenging from a canvassing perspective.
Next: A look at turnout rate.