By Adam Pagnucco.
In Part Two, we looked at the geographic distribution of voters. Today we will look at turnout rate.
Where is the Turnout?
This is a different question than number of votes cast since turnout rate measures the percentage of eligible voters who actually vote. This is an important bang-for-the-buck consideration for all campaigns with finite resources (which are basically all of them that are not headed by David Trone).
First, the Democrats. The charts below show 2022 Democratic primary turnout rates in each county and in each of the Democrats’ top voting twelve towns.
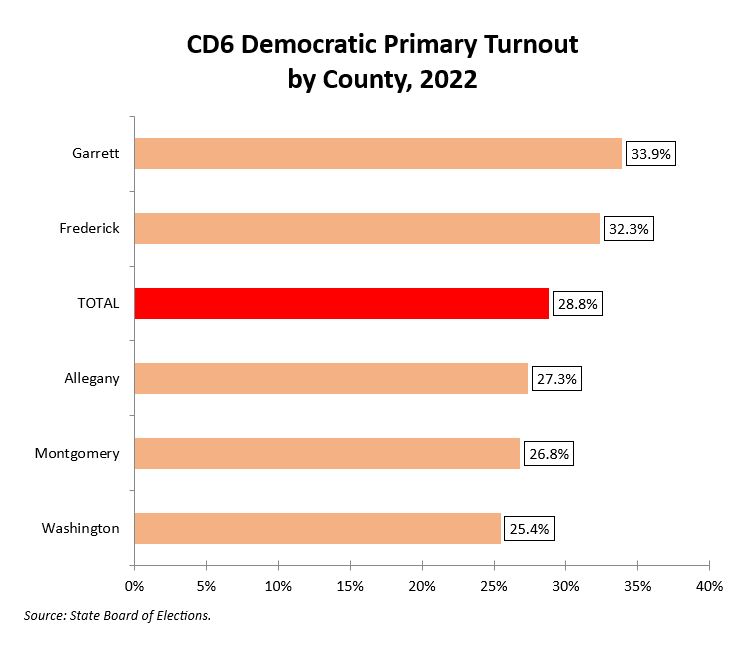
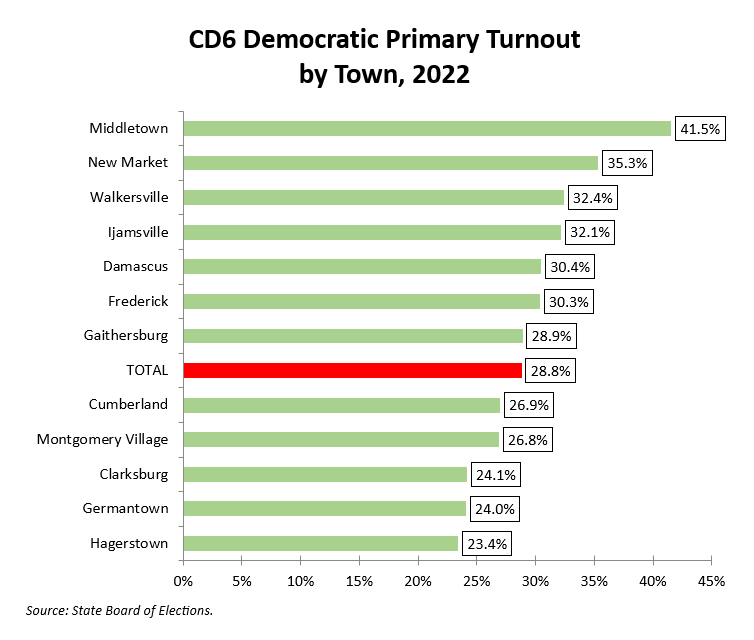
MoCo is a leader in number of votes cast but it is not a leader in turnout rate. MoCo politicos are well aware of low turnout rates in Upcounty, part of which comprises the county’s portion of CD6. It’s the mid-size Frederick County towns, not the ones in MoCo, who lead in turnout rate.
Now to the Republicans. The charts below show 2022 GOP primary turnout rates in each county and in each of the Republicans’ top voting twelve towns.
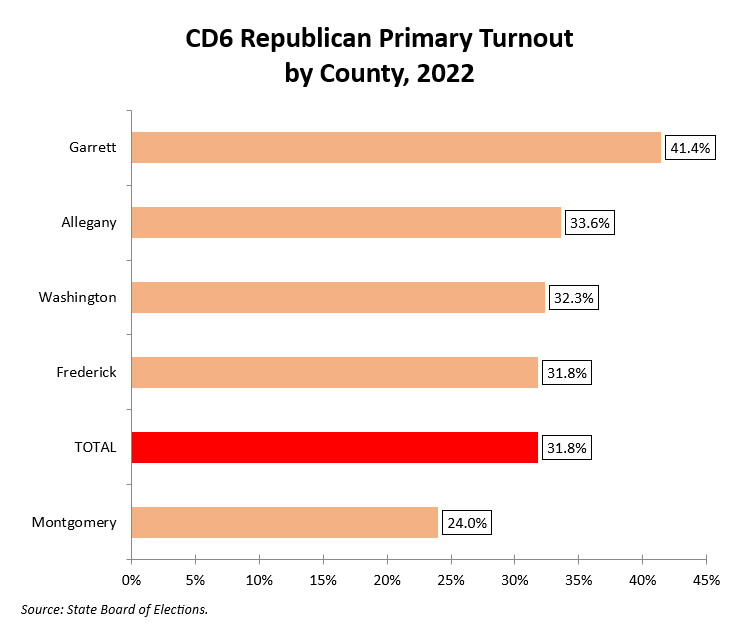
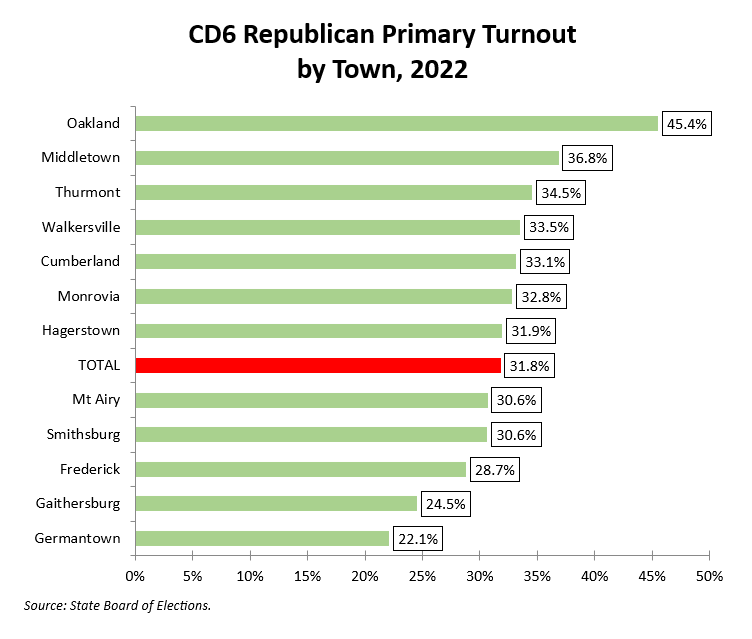
If the turnout rate among MoCo Democrats is low, the turnout rate among MoCo Republicans is pathetic. Gaithersburg and Germantown have rock bottom GOP turnout and Clarksburg and Montgomery Village, both decently sized MoCo towns, are not even in the GOP’s top 12. Allegany and Garrett counties are not players in the Democratic primary, but they matter in the Republican primary because they have significant numbers of GOP voters and relatively high turnout rates.
CD6 Democrats and Republicans may live in the same district, but politically, they are in different worlds. The winning campaign strategies in the two party primaries are going to look very different in geographic terms. And those candidates will carry those geographic strengths and weaknesses to the general election.
Next, we will start linking demographics to voting in CD6.