By Adam Pagnucco.
Household income is a known predictor of turnout. In MoCo, wealthy areas like Bethesda and Chevy Chase are regularly among the county’s turnout leaders while less affluent areas like Glenmont/Norbeck and Montgomery Village are among the laggards. This pattern largely held in the 2022 Democratic primary. So are income and turnout positively correlated in CD6?
The surprising answer is yes and no.
First, let’s look at the distribution of income across CD6 as measured by median household income from the Census Bureau’s 2017-21 American Community Survey. Let’s start with the counties. Information for MoCo is limited to the zip codes inside CD6.
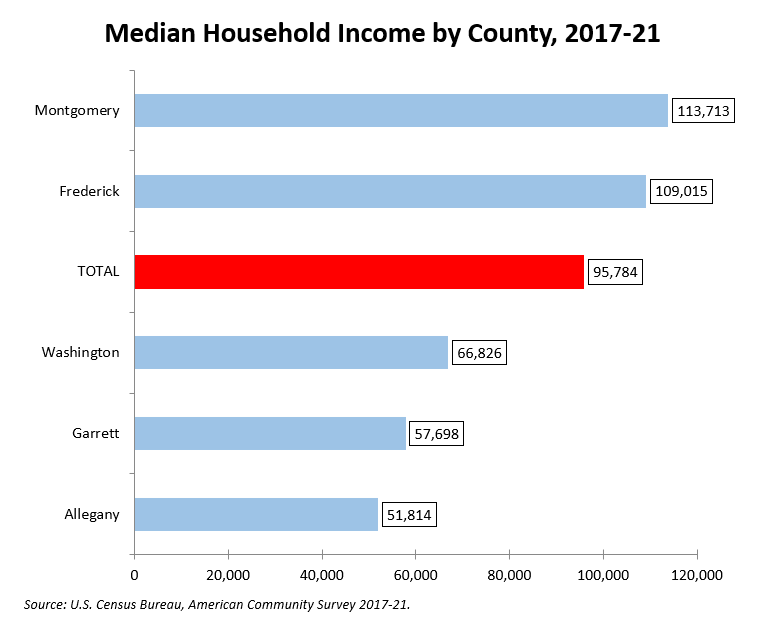
This makes clear what virtually everyone in the district knows: economically speaking, MoCo and Frederick are in a different world than Western Maryland.
Now let’s look at median household income in the district’s largest towns.
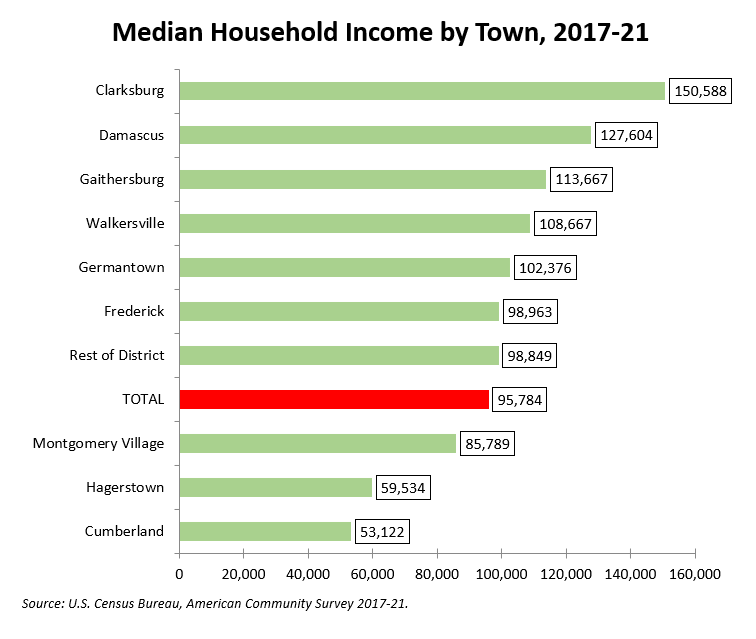
Again, the differences are stark. Cumberland’s income is roughly a third of Clarksburg’s.
The chart below shows turnout in the 2022 Democratic by zip code median household income.
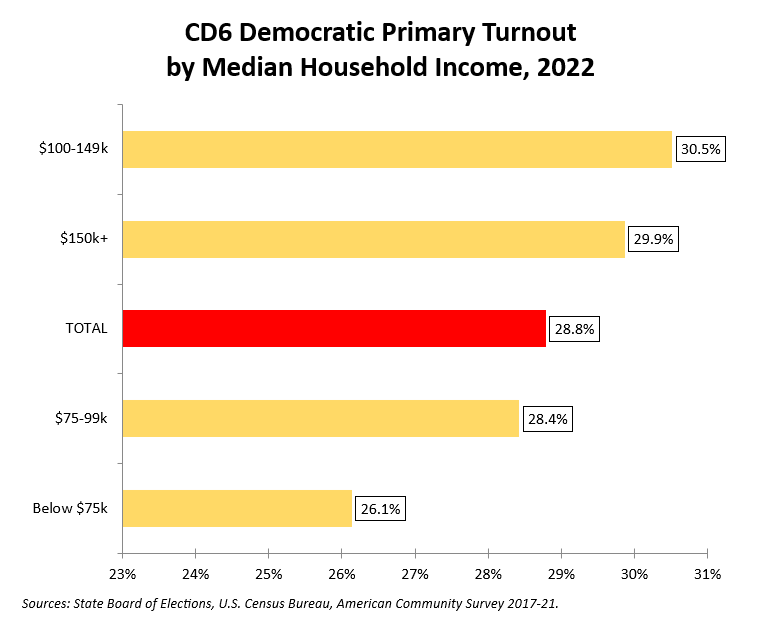
This trend is what we expect to see although it’s rather modest – much more modest than what we have seen in MoCo. This is probably because MoCo’s part of CD6 has relatively high incomes but also low turnout, thereby interfering with the correlation of the two.
Now let’s look at the Republican primary.
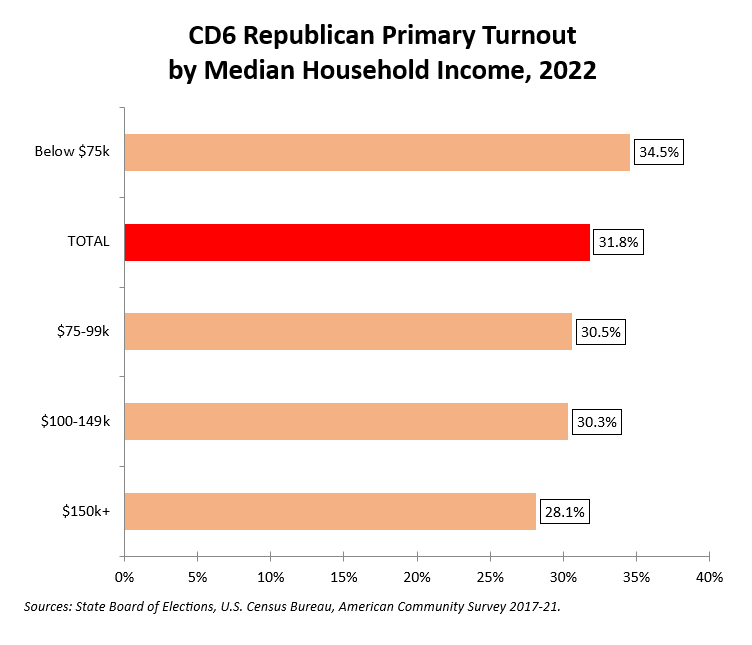
The trend among Republicans is the opposite of what we see from the Democrats. Why? Remember the trend we saw in incomes above – the further west you go, the lower they are. That interfaces with another trend in the district – the further west you go, the more Republican it becomes and the higher GOP turnout gets. We saw this trend clearly in Parts Two and Three. This suggests that Democrats may be more affluent than Republicans, at least in CD6, and this may play out in issue preferences. That will surely be of interest to whichever nominees advance to the general election.