By Adam Pagnucco.
As we explained in Part One, the IRS tracks the inflow and outflow of returns, exemptions and adjusted gross income (AGI) for all states and counties. Comparable data starts in 1993 and continues through 2021. Here is what the data on returns and AGI looks like for Montgomery County.
Returns
The chart below shows out-migration and in-migration of tax returns to MoCo.
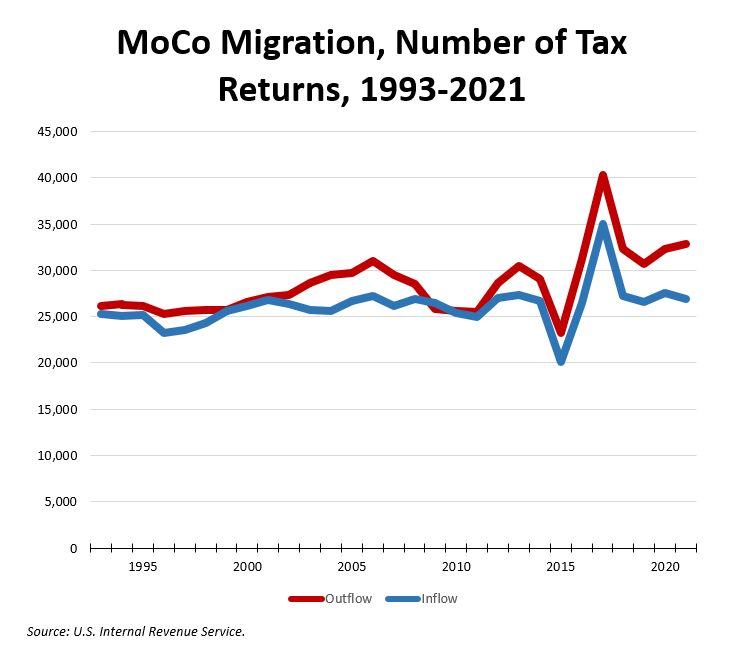
In most years, out returns exceed in returns, meaning – at least among households known to the IRS – there is a net migration out. The drop and spike in 2015-18 affecting both ins and outs makes me wonder if some of those returns were misplaced by year. For what it’s worth, that pattern affects other jurisdictions and not just Montgomery County as we shall see later in the series.
The chart below shows net out-migration of returns.
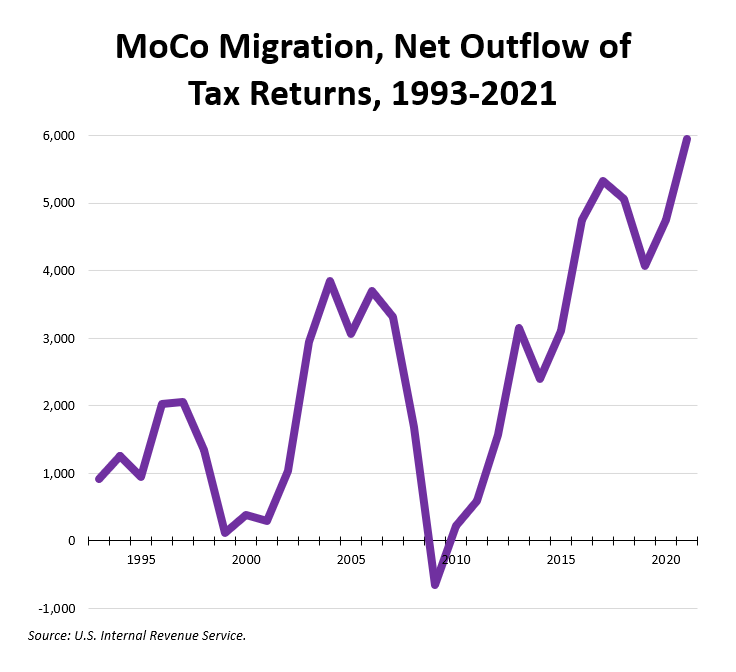
Net out-migration dropped sharply in two recessions – the one around 9-11 and the Great Recession. In fact, 2009 saw net in-migration of 658 returns, the only positive year in the series. The Great Recession saw a sharp decrease in home values, so many folks may have chosen to stay put rather than take losses on home sales.
AGI
Now let’s look at migration of adjusted gross income (AGI) in inflation-adjusted 2021 dollars. The chart below shows out-migration and in-migration of real AGI to MoCo.
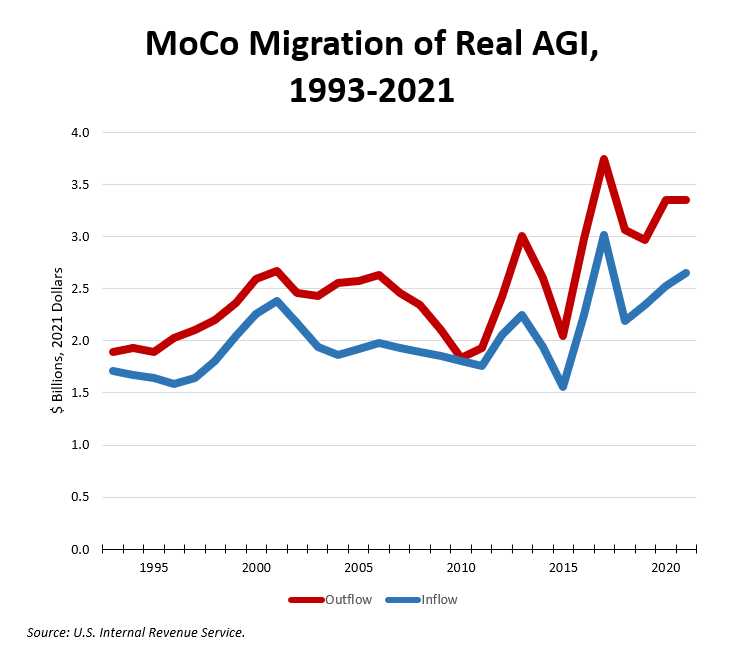
Once again, the drop and spike in 2015-18 shows up in this data. Take those years away and there is a clear increase in migration, both in and out, since then.
The chart below shows net out-migration of real AGI.
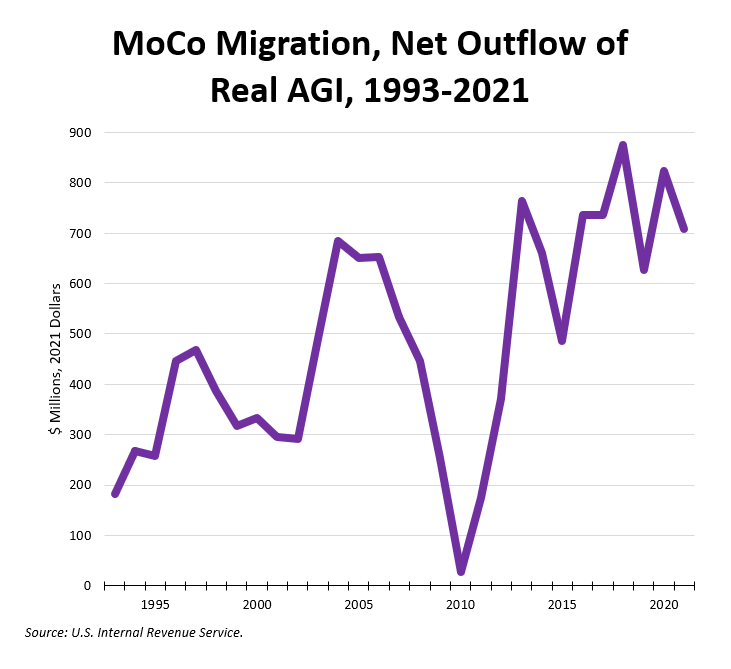
This chart shows Montgomery County’s problem. The county has long had net out-migration of taxpayer income, which was nearly interrupted by the Great Recession. But this out-migration has ranged between $600 million and $900 million annually over the last six years. That’s a substantial hit on our taxable income base, which forms the foundation of our income tax receipts.
We shall explore the components of this net loss in the next part of this series.