By Adam Pagnucco.
Now that the county’s most recent operating budget has been published, it’s time to look at how county government spends your money. We are going to use three kinds of analyses in this exercise.
First, we will look at the largest departments and agencies in county government. We will identify how much each one spends from Schedule B-2, which shows all funds expenditures.
Second, we will look at broad categories of expenditure. Local government starts with three necessary purposes: educate residents (education), protect residents (public safety) and provide transportation facilities to help residents get around. We will include two other categories: debt service, which finances the capital budget, and a very broad everything else category.
Third, we will look at three time periods.
Short term is the one year change in expenditures between the FY23 and FY24 approved budgets.
Medium term is the five year change in expenditures between the FY19 actual budget and the FY24 approved budget. This is the cumulative budgetary record of County Executive Marc Elrich and Council Members Gabe Albornoz, Andrew Friedson, Evan Glass and Will Jawando, all of whose elected tenures exclusively overlapped with this period. (Council Member Sidney Katz also served in the four years prior to this period.)
Long term is the change in expenditures between the FY10 actual budget and the FY24 approved budget. The roster of elected officials has almost totally turned over during this period. The exception is Elrich, who was on the council in FY10 and is the county executive today. Many things happened during this period including the Great Recession, spending cuts, a local dollar per pupil freeze at MCPS, multiple tax hikes and the COVID pandemic. This period enables an examination of the overarching evolution of county government.
Let’s start with the most recent one-year change in spending, shown in the table below. Note that MCPS is broken down into three categories: change in local money (the county appropriation directly controlled by the county council, which comes from Schedule A-6), change in the total MCPS appropriation, and change in non-local money (chiefly state and federal aid, grants and internally generated revenues).
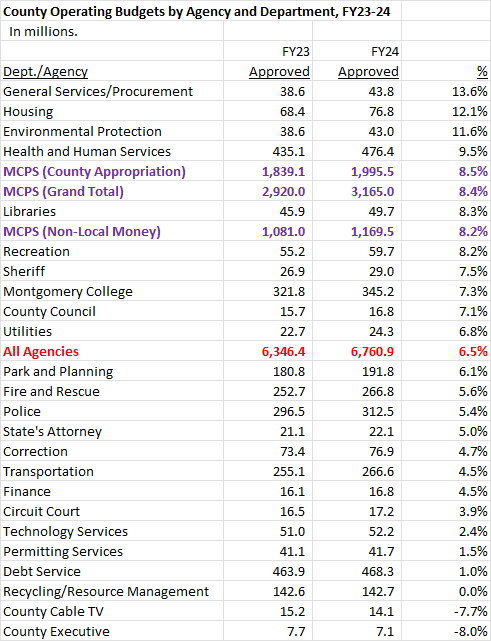
Despite an outcry from MCPS and the teachers union about cuts, MCPS did really well this year. In fact, it received its biggest budget increase in at least 20 years. But lots of other departments and agencies did well too, including a few who actually did better than MCPS. This reinforces the truth told in the Central Fiction of Elrich’s Budget, which is that though this year’s 4.7% property tax hike was targeted for MCPS, the money was spread throughout county government because it’s fungible.
Now let’s look at the change in broad category. In FY24, 52% of the operating budget went to education (MCPS plus Montgomery College), 10% went to public safety (animal services, consumer protection, correction, emergency management, fire and rescue, police and sheriff), 4% went to transportation, 7% went to debt service and 27% went to everything else.
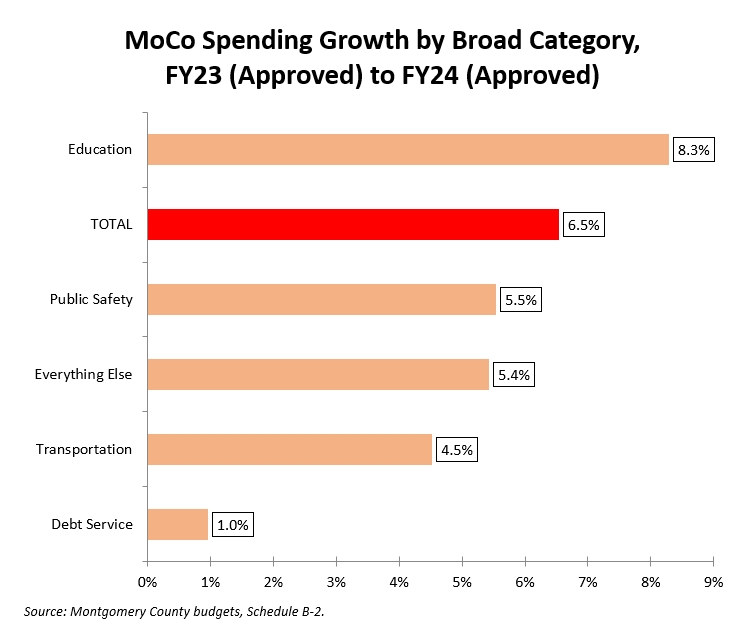
Once again, education led the way. Growth in debt service was minimal. That’s great for the operating budget but it does suggest tightness in the capital budget.
Do these trends hold in the medium term? We will find out in Part Two.