By Adam Pagnucco.
Last time, we looked at total operating budget per pupil. Today we will look at spending measures based on county appropriations.
School districts have many sources of funding. One of them, and in some cases the biggest, is the county appropriation. This is directly controlled by county councils and county commissions but is subject to state mandates. The most important of these is the state’s maintenance of effort law. The recent passage of the Blueprint program has made this law more complicated than it used to be, but one of its most important provisions is that – generally speaking – a county’s appropriation per pupil in the current fiscal year is the minimum amount permitted in the following year. It’s possible to get a waiver from the state to go lower but it’s not easy.
The chart below shows county appropriations as a percentage of total school operating budgets in FY24.
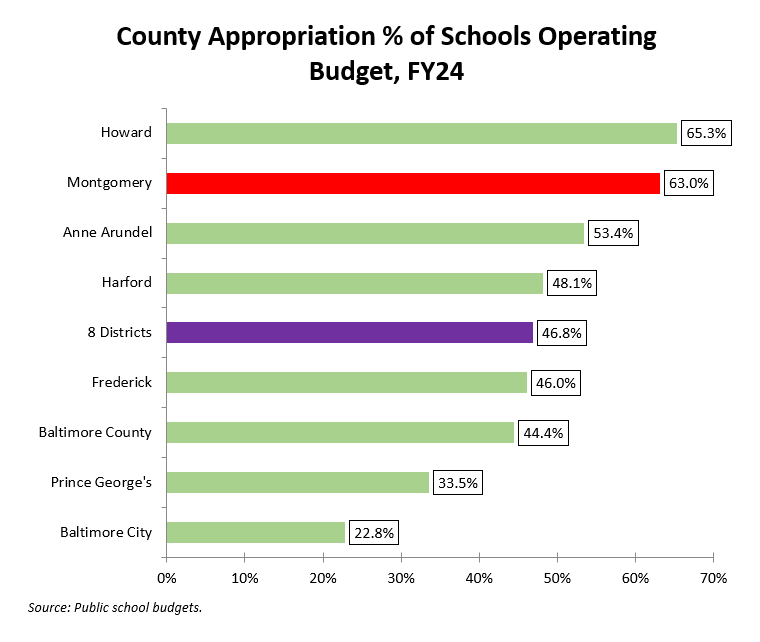
The principal reason why these percentages are so different is that state aid for schools is driven by wealth formulas. Counties with higher net taxable income or assessable base per capita get less money per pupil than less wealthy counties. So the state disproportionately subsidizes schools in Baltimore City, Prince George’s County and other less affluent jurisdictions and county taxpayers disproportionately support schools in wealthier areas like Howard and Montgomery counties. This has been the case for a very long time.
Now let’s get to county appropriations, the money that county councils and county commissions directly control. The chart below shows growth in county appropriations to schools from FY23 through FY24.
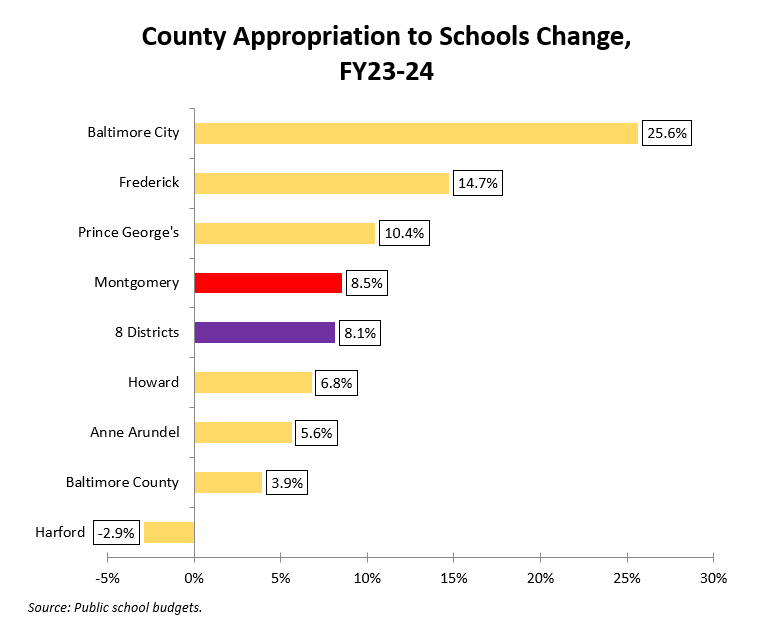
Despite its tax increase, MoCo was exceeded on this measure by Baltimore City and Frederick and Prince George’s counties. There are reasons for this, but first, let’s look at the change in county appropriations from FY17 through FY24.

MoCo ranks at the bottom here because generous school budgets in the last two years have not made up for less generous budgets in the prior five years. Frederick County is the leader in large part because its enrollment has exploded.
Why are we seeing these patterns? We will have more, including county appropriations per student, next.