By Adam Pagnucco.
Part One introduced this series. Part Two examined total employment. Part Three examined private employment. Part Four examined establishments. Today, we look at wages paid.
The U.S. Bureau of Labor Statistics’ Quarterly Census of Employment and Wages (QCEW) program, upon which this series is based, defines wages this way:
Total compensation paid, including bonuses, stock options, severance pay, profit distributions, the cash value of meals and lodging, tips and other gratuities, and, in some states, employer contributions to certain deferred compensation plans (such as 401(k) plans), during the calendar quarter, regardless of when the services were performed.
In this series, we used the Washington-Arlington-Alexandria CPI-W to convert nominal wages to real wages to adjust for inflation. I suppose there was no need for this because since the whole region uses the same inflation index, the use of real dollars does not affect relative comparisons between local jurisdictions. But details matter folks, so why not?
One caveat: this series only measures wages paid by employers. It does not include other income, such as earnings of the self-employed. This is not a trivial omission as MoCo is one of the leaders in the D.C. region in proprietors and proprietor income. I will return to this issue in the future.
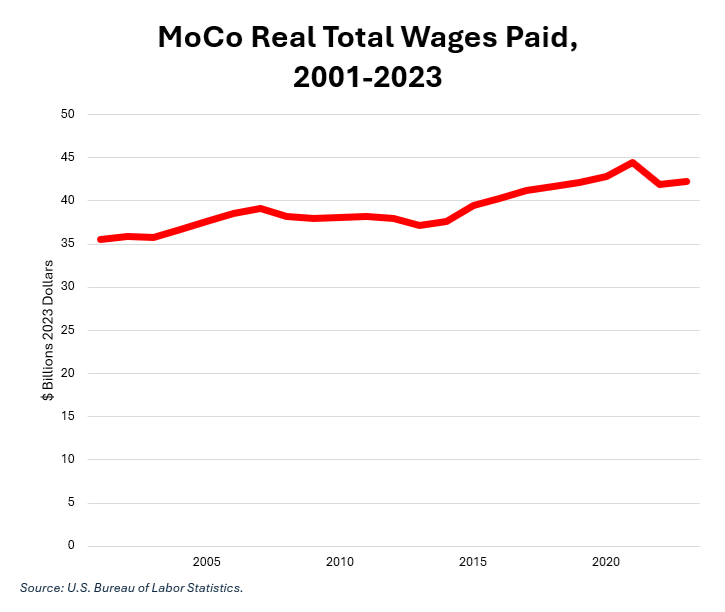
The chart below shows Montgomery County’s real total wages paid since 2001, when the current QCEW series began.

This measure has increased over time but has varied strongly with the business cycle. The years during and after the Great Recession and the brief pandemic recession saw declines among an overall trend of growth. One question I have is to what extent the periods of decline were mitigated by any increases in proprietor income, a subject for further investigation.
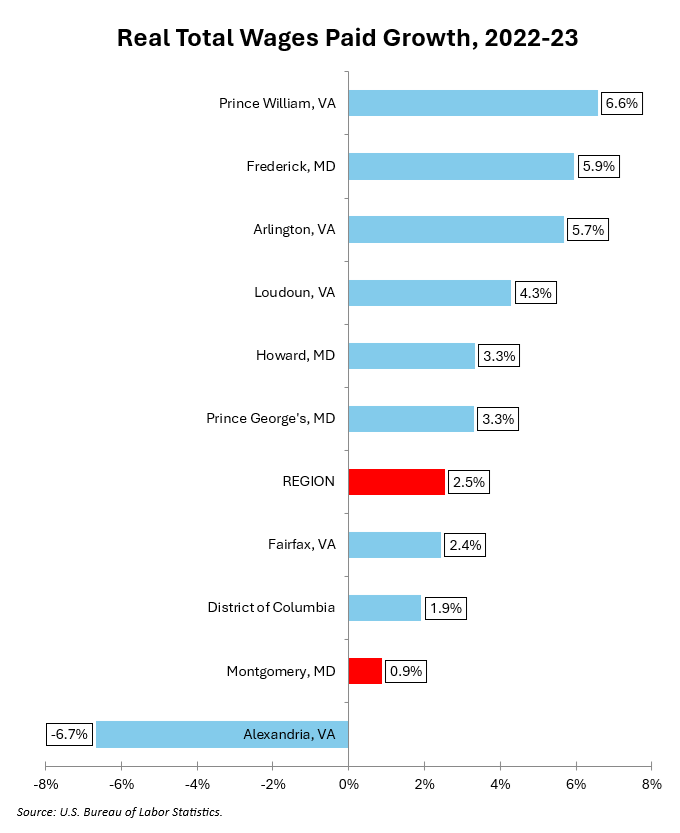
Now let’s see how we did last year. Included are the ten largest jurisdictions in the region as well as the regional total, which includes all jurisdictions in the Washington-Arlington-Alexandria Metropolitan Statistical Area.

As of this writing, we gained $360 million in real wages paid for a growth rate of 0.9% in 2023. (The current data is preliminary so the ultimate calculation may vary a bit.) The region’s real total wages grew by 2.5%. Among large jurisdictions, only Alexandria trailed us.
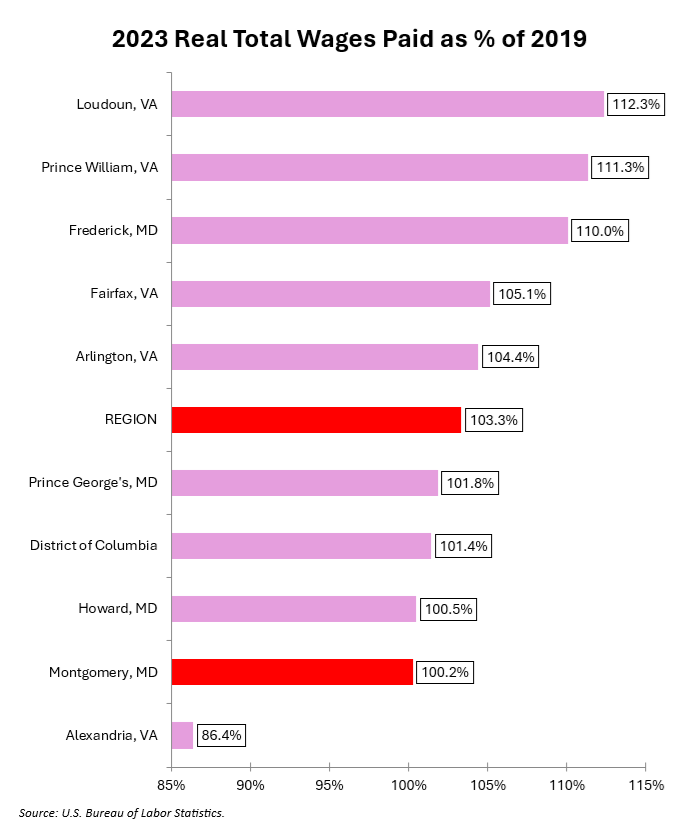
Now let’s look at our 2023 real total wages as a percentage of our 2019 real total wages. This measures our recovery from the pandemic.

The good news is that we have recovered from the pandemic on this measure. The bad news is that every major jurisdiction in the region has done better than us except for Alexandria.
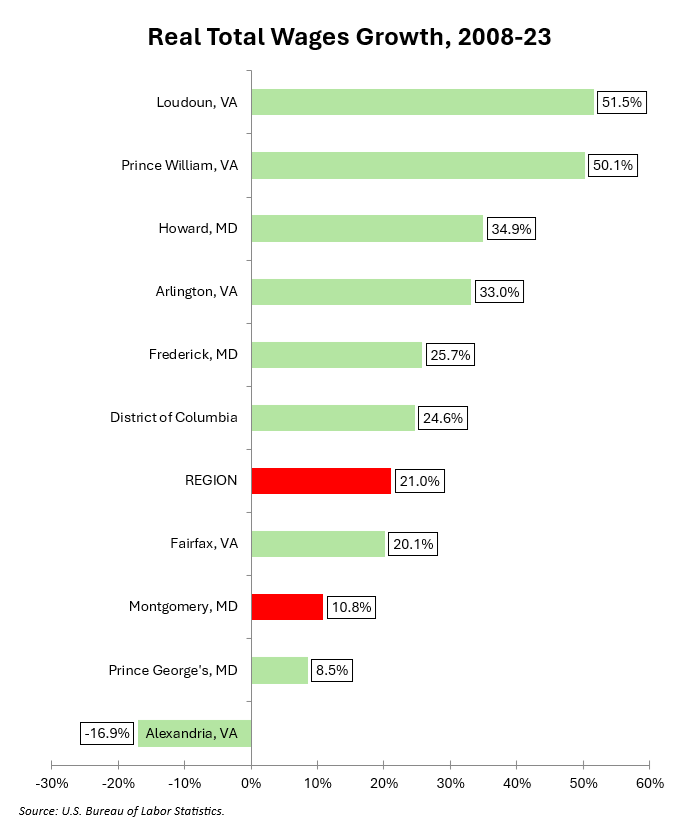
Finally, the 15-year trend appears below. I picked 2008 as the base year because that was the Washington region’s peak employment year before the Great Recession.

We did better than Prince George’s and Alexandria over the last fifteen years but most of our competitors blew us away. This is yet another indicator of our long-term economic problems.
Part Six will conclude.
