By Adam Pagnucco.
Part One revealed that the precinct performances of the three school board candidates on MCEA’s Apple Ballot – Rita Montoya (At-Large), Natalie Zimmerman (District 2) and Laura Stewart (District 4) – were correlated. Part Two looked at the geography of these Apple Ballot candidates’ performance. Now let’s look at precinct racial patterns.
In my election methodology post, I discussed how I used U.S. Census data on race by precinct to construct proxies for racial voting patterns. I have used this data before, most recently in looking at voter turnout in this year’s primary.
The charts below combine the votes of the three Apple candidates, divide them by the total votes cast for school board in each precinct and show them by racial percentage ranges in those precincts. Let’s start with Asian population percentage.
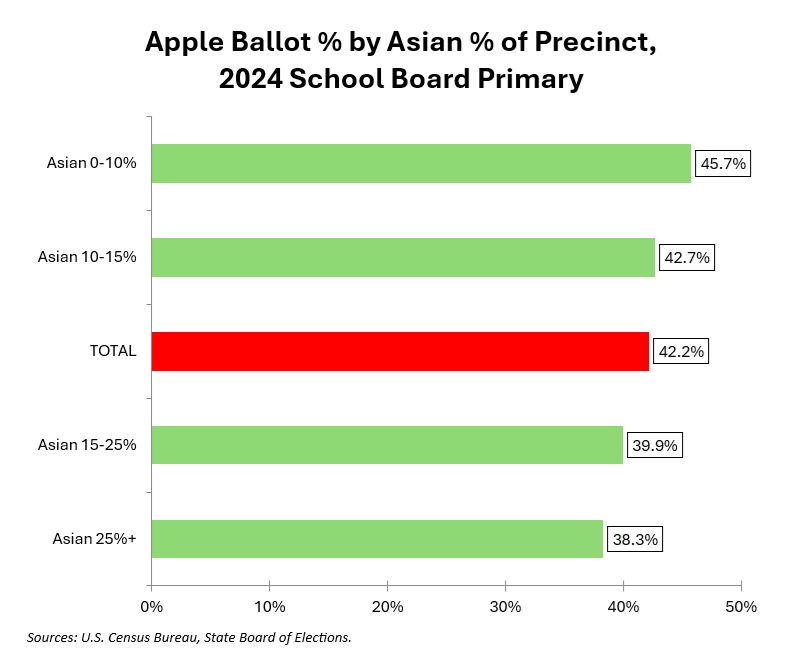
As the Asian percentage of precincts climbed, Apple Ballot candidate performance declined, though not by a lot. Do Asian voters have a problem with the Apple? I’m not convinced of that since heavily Asian precincts tend to be located in or near Upcounty, where the Apple tends to be weakest. Still, if I were in MCEA, I would be curious about this.
Next, let’s look at precincts by Black population percentage.
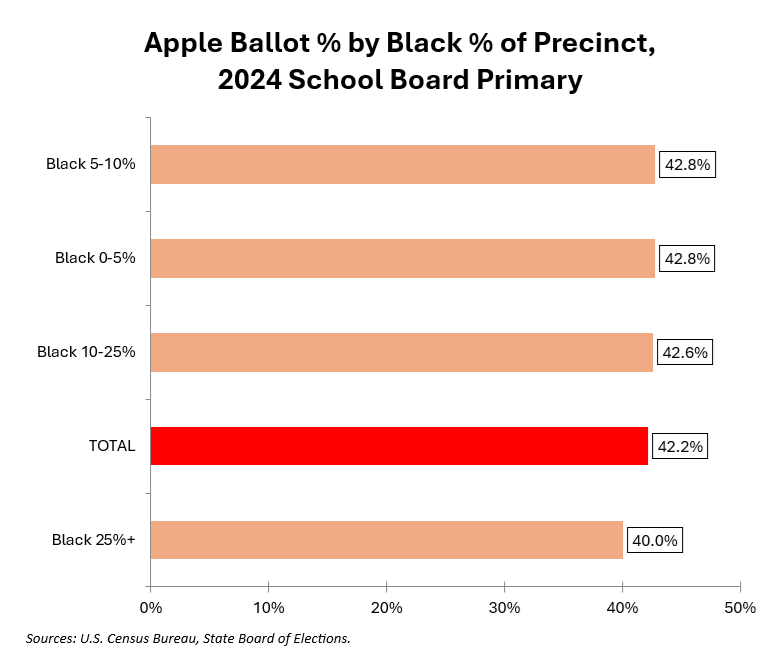
Black percentage does not look all that associated with Apple performance.
The chart below shows Latino population percentage.
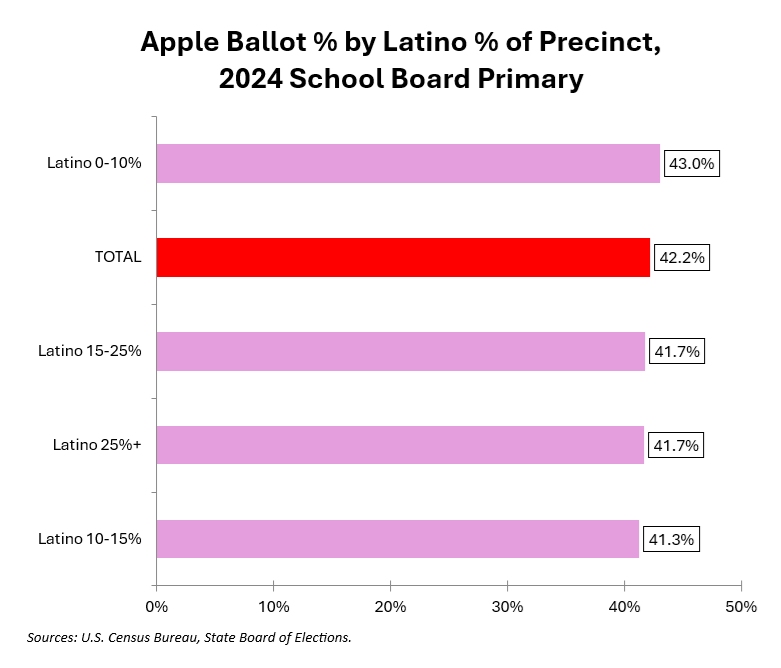
Again, Latino percentage does not seem to matter much.
Finally, let’s look at White population percentage.
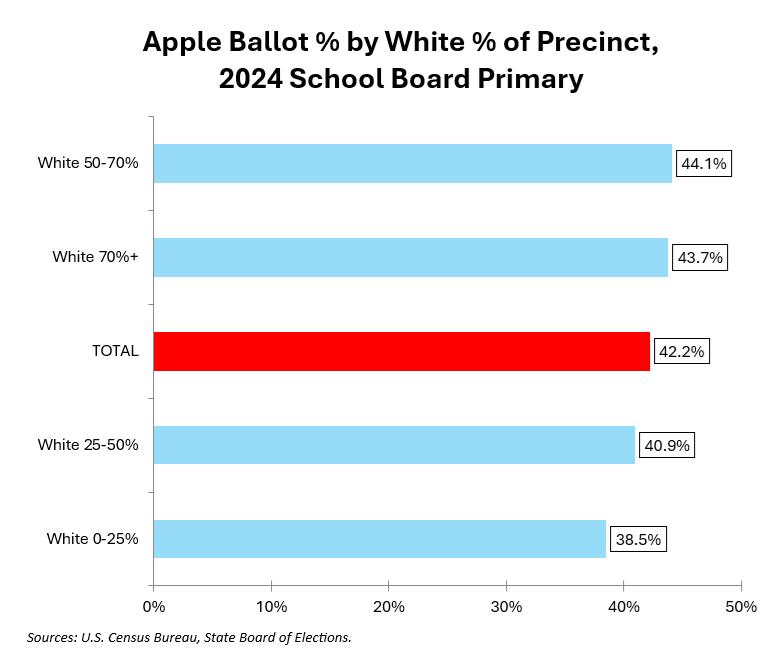
There may be a slight Apple advantage in heavily White precincts, but if there is, it’s probably because the Apple did well in Chevy Chase and Kensington as shown in Part Two.
Let’s finish with a chart showing Apple vote percentage in the 25 precincts with the highest population percentages for each of the four major racial groups.
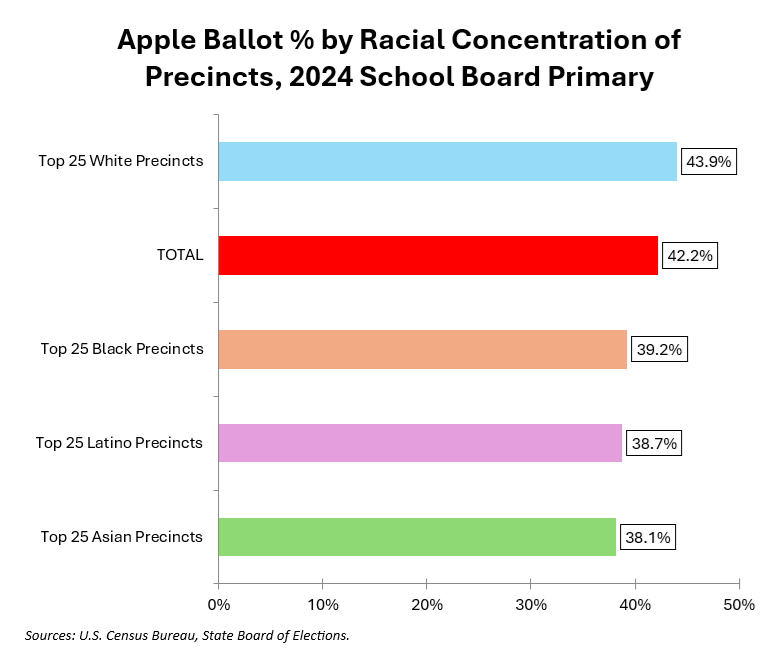
These are not big differences.
Overall, this does not paint a persuasive case that race is related to Apple Ballot performance, at least not in this particular election. But in Part Four, we will look at a more impactful factor: party affiliation.