By Adam Pagnucco.
Part One revealed that the precinct performances of the three school board candidates on MCEA’s Apple Ballot – Rita Montoya (At-Large), Natalie Zimmerman (District 2) and Laura Stewart (District 4) – were correlated. Part Two looked at the geography of these Apple Ballot candidates’ performance. Part Three looked at precinct racial patterns. Now let’s look at party affiliations.
The conventional wisdom in MoCo politics is that Democratic primaries are the real elections here since Democratic candidates sale through general elections. That’s been true for 20 years in most races, but it’s not the case for school board seats. School board races are non-partisan. Candidates don’t have party labels and all voters regardless of party affiliation can vote in primaries and generals. That means Republican, unaffiliated and small party voters matter, just as they do on ballot questions, and the Apple Ballot must contend with them.
Part One of my turnout series showed that 79% of actual voters were Democrats, 15% were Republicans and 6% were unaffiliated in the 2024 primary. These voters are not distributed equally across the county. The rule of thumb here is that the further one goes from the D.C. border, the higher the percentages of Republicans and unaffiliated voters get. For example, in the 2024 primary, Republicans were 9% of actual voters in the Democratic Crescent and 21% of actual voters in Upcounty. Another example: in the 2024 primary, Republicans were 3% of actual voters in Takoma Park and 37% of actual voters in Damascus.
The charts below combine the votes of the three Apple candidates, divide them by the total votes cast for school board in each precinct and show them by partisan percentage of vote ranges in those precincts. Let’s start with precincts organized by the Democratic percentage of votes cast.
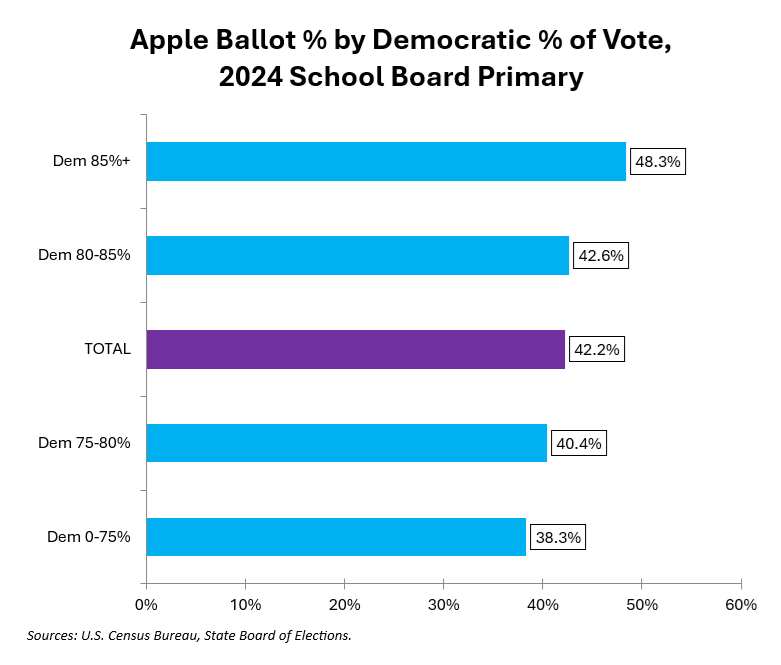
In precincts where at least 85% of the votes were cast by Democrats, the Apple candidates received a combined 48% of the votes. In precincts where less than 75% of the votes were cast by Democrats, they received 38% of the votes. That’s a ten-point spread.
Now let’s look at precincts organized by the Republican percentage of votes cast.
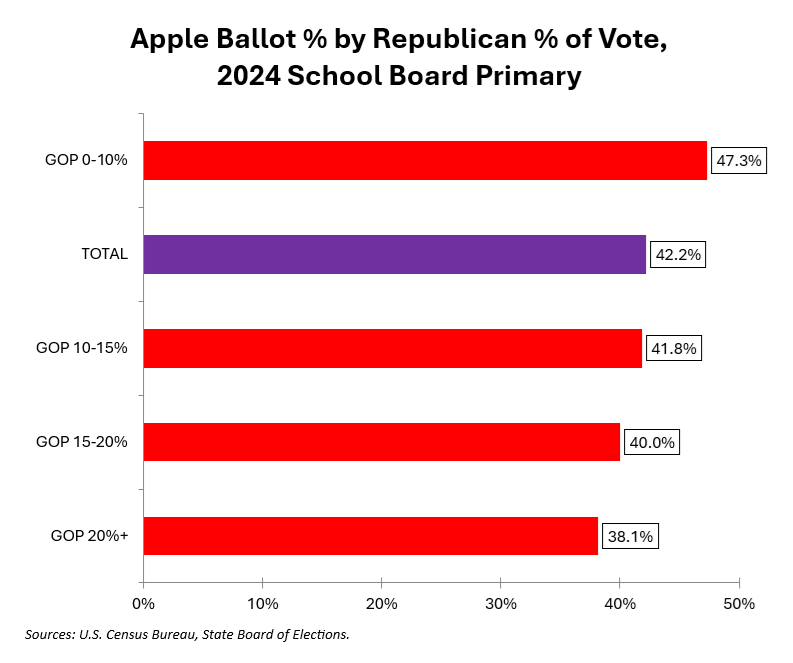
In precincts where at least 20% of the votes were cast by Republicans, the Apple candidates received a combined 38% of the votes. In precincts where less than 10% of the votes were cast by Republicans, they received 47% of the votes. That’s a nine-point spread.
The chart below shows precincts organized by the unaffiliated percentage of votes cast.
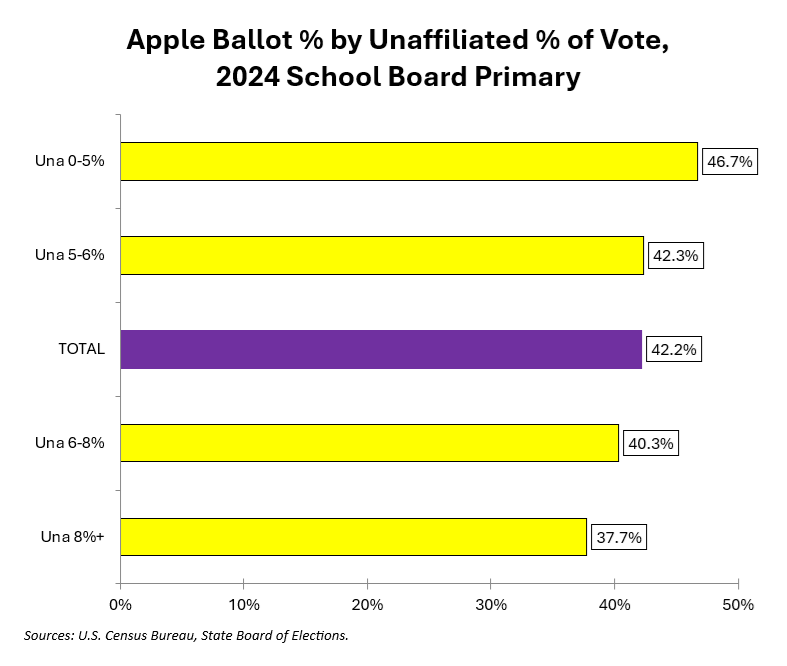
In precincts where at least 8% of the votes were cast by unaffiliated voters, the Apple candidates received a combined 38% of the votes. In precincts where less than 5% of the votes were cast by unaffiliated voters, they received 47% of the votes. Again, that’s a nine-point spread.
Finally, the chart below shows Apple vote percentage for each of the 25 precincts that had the highest percentages of votes cast by members of each group.
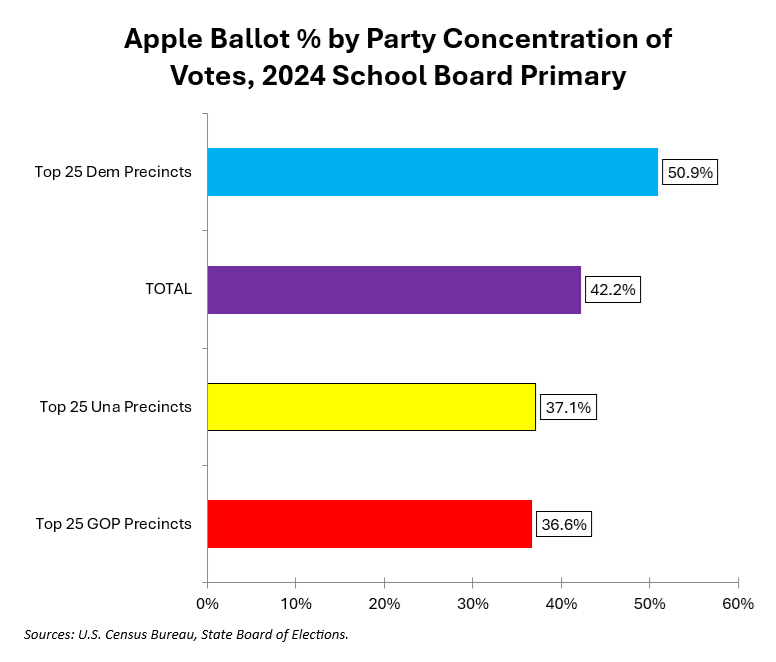
This shows the clearest difference of all the charts. In the top 25 most heavily Democratic precincts, measured by the percentage of actual votes cast by Democrats, Apple candidate performance was 14 points higher than in the most heavily Republican and unaffiliated precincts.
Race did not seem to have much of an impact on Apple Ballot performance but party affiliation did.
I could examine this in much greater detail using cast vote data, which enables direct analysis of party member voting, and maybe I will. But in the meantime, the Apple Ballot had a big impact on the 2024 school board primary as each of its candidates is headed to the general election. We shall see how many of them win in November.