By Adam Pagnucco.
Part One looked at the performances of Prince George’s County Executive Angela Alsobrooks and Congressman David Trone by county. Part Two looked at their performances by broad MoCo region (Democratic Crescent, Upcounty and rest of county). Part Three looked at congressional, state and council districts. Part Four looked at local areas. Today, let’s look at precinct racial patterns.
In my election methodology post, I discussed how I used U.S. Census data on race by precinct to construct proxies for racial voting patterns. This may not be as precise as using racial data on Democrats from proprietary sources like MDVAN – data which is itself imperfect – but it gives a hint as to what’s going on. I looked at this data in depth in my turnout series.
Unlike earlier posts, I am just going to look at Alsobrooks’s performance today. (If I were to include Trone and percentage margins, this would be a MUCH longer series!) Let’s start with Alsobrooks’s performance by Asian population percentage in precincts.
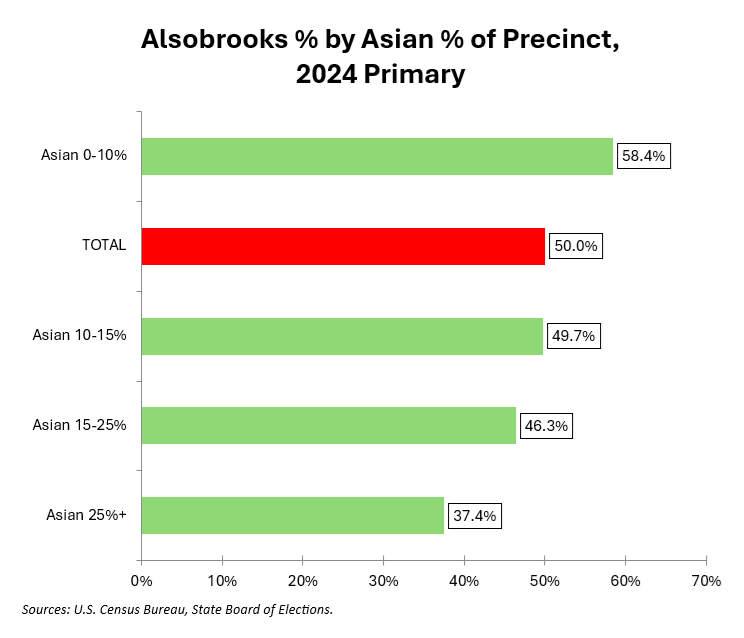
This is the strongest racial pattern in the series. In precincts with Asian populations of 25% or more, Alsobrooks received 37% of the vote. In precincts that were less than 10% Asian, she received 58% of the vote. That’s a huge spread.
Does Alsobrooks have a problem with Asian voters? I’m not convinced of that for two reasons. First, the most heavily Asian precincts in MoCo tend to be in Trone’s congressional district, giving him a home field advantage. Second, Howard County has the highest Asian percentage in Maryland and Alsobrooks won it by 10 points. I would be curious about this issue if I were working for Alsobrooks’s campaign, but it could be just an accident of MoCo district geography.
Now let’s look at Alsobrooks’s performance by Black population percentage in precincts.
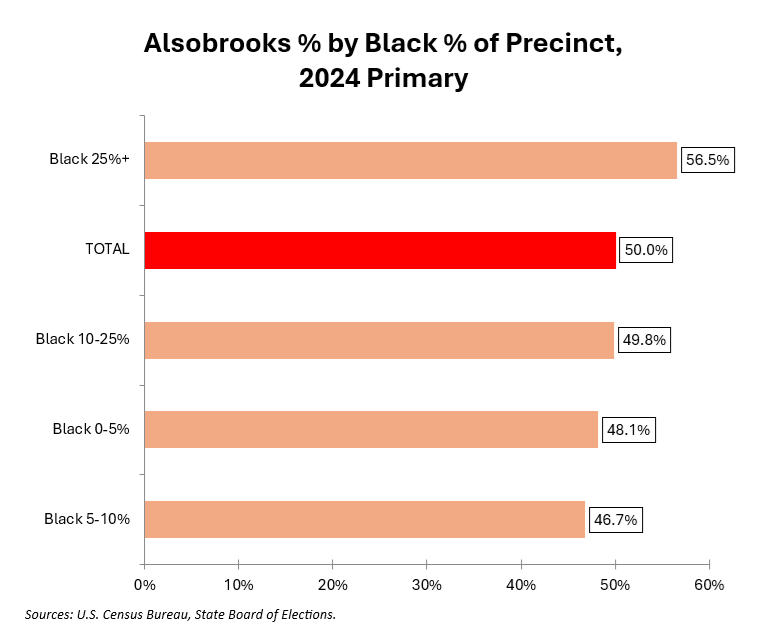
As expected, Alsobrooks overperformed in heavily Black precincts but the spread is not huge. Compare this to the large percentages she received in Baltimore City and Charles County in Part One.
Let’s examine Alsobrooks’s performance by Latino population percentage in precincts.
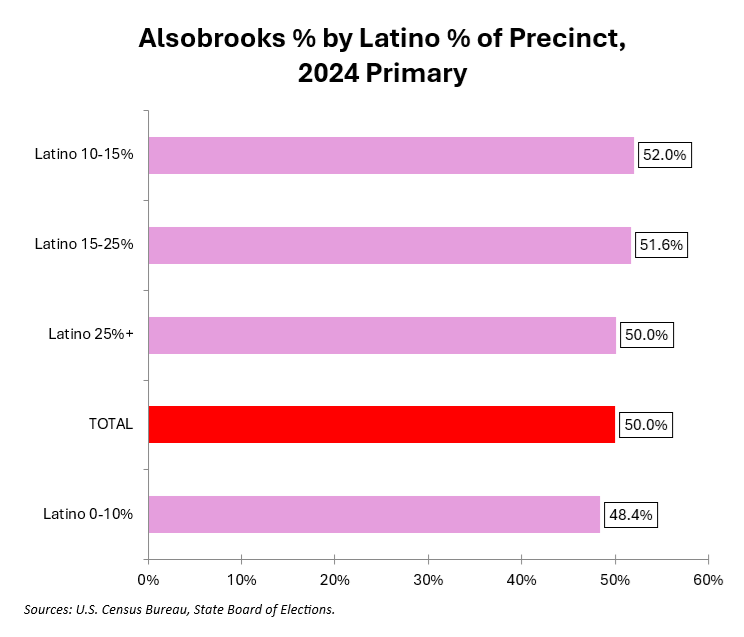
Latino percentage did not matter very much.
Now let’s look at Alsobrooks’s performance by White population percentage in precincts.
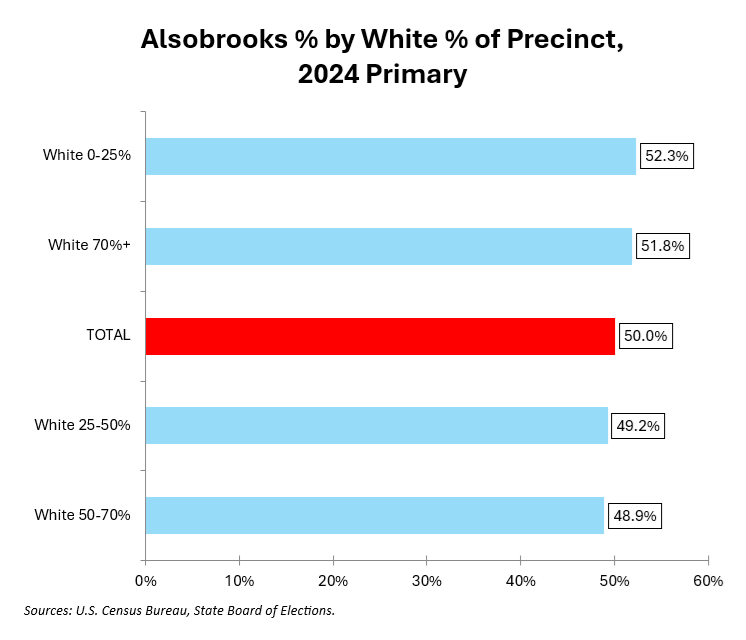
Again, this is not very meaningful.
Let’s finish with a chart showing Alsobrook’s vote percentage in the 25 precincts with the highest population percentages for each of the four major racial groups.
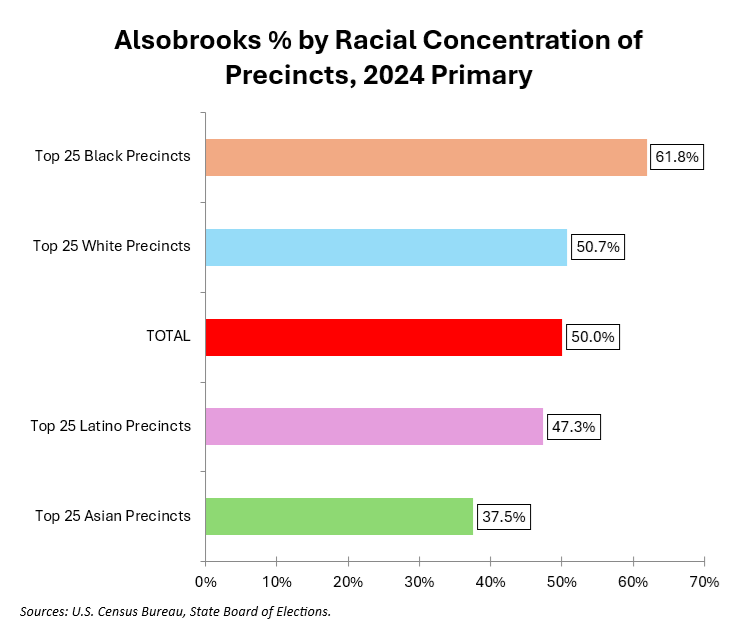
Alsobrooks’s performance in MoCo’s 25 most heavily Black precincts closely resembles her vote percentage in Baltimore City and Charles County. Black voters are clearly a plus for her. What’s more interesting is that the most heavily White precincts did not vary from her average. That means, at least in MoCo, White voters were not a negative for her.
Now let’s be clear: a lot of the heavily White precincts are in Bethesda, Chevy Chase and Kensington – politically liberal areas that voted for Alsobrooks and idolize two of her strongest endorsers, Senator Chris Van Hollen and Congressman Jamie Raskin. Such influences may not be as strong in other White areas around the state.
Still, MoCo is Maryland’s most diverse county and Alsobrooks showed she is capable of putting together a multi-racial coalition in her quest for the U.S. Senate. Will it be enough to send her to Washington?
