By Adam Pagnucco.
Part One introduced the premise of this series: the use of cast vote records to examine partisan differences in voting in the 2024 school board primary. Part Two looked at turnout by party. Part Three examined voting for school board incumbents by party. Part Four looked at ballot placement. Now let’s examine partisan voting for the Apple Ballot.
The Apple Ballot, the mechanism for distribution of endorsements by the Montgomery County Education Association (MCEA), has been one of the most potent factors in MoCo politics for decades. I recently ran a series on precinct results for its 2024 school board candidates. (See these links for Parts One, Two, Three and Four.) One of the facts I revealed is that votes for Apple candidates were correlated with the distribution of partisan votes within precincts. In precincts dominated by Democratic voters, Apple candidates did better. In precincts with above average representation by Republicans and unaffiliated voters, Apple candidates did worse. Cast vote records enable examination of this factor in more detail because – at least in primaries – they list the party affiliation of individual voters. Do cast vote records confirm the precinct analysis?
Before looking at the data, let’s note that the percentages in this series are different than those reported by the State Board of Elections because the denominator here includes overvotes and undervotes, not just votes for candidates. Overvotes occur when a voter votes for more candidates than allowed (for example, voting for two people for just one seat). Undervotes occur when a voter does not cast a vote for that seat. Undervotes are very common in school board races. One of the advantages of using cast vote records, as this series does, is that they explicitly include overvotes and undervotes. So when overvotes and undervotes are included, the percentage received by any one candidate or groups of candidates is lower than when overvotes and undervotes are excluded.
Counting overvotes and undervotes, the three candidates appearing on the Apple Ballot (Rita Montoya at-large, Natalie Zimmerman in District 2 and Laura Stewart in District 4) received 33% of all votes cast in the primary. (Excluding overvotes and undervotes, they received 42%). Here is how their combined vote was distributed by party.
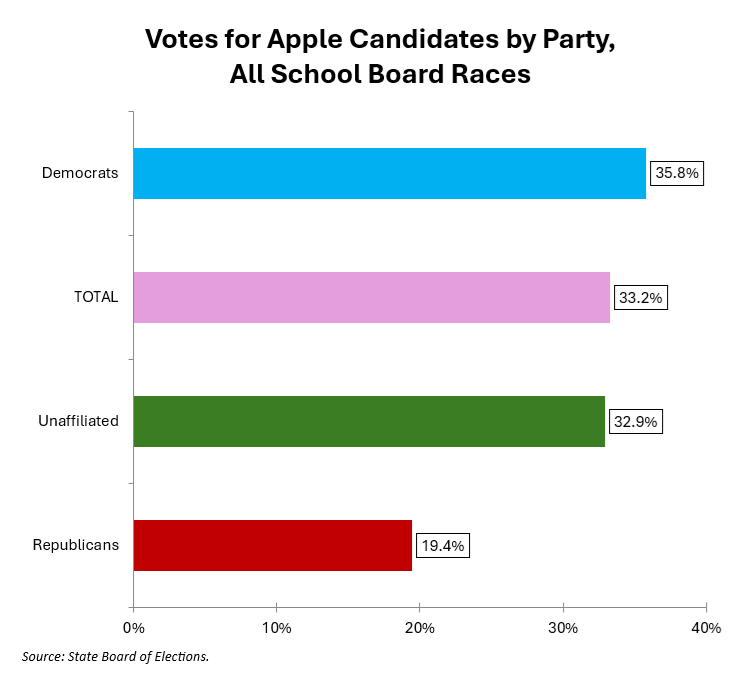
36% of all votes by Democrats went to Apple candidates. Unaffiliated voters gave Apple recipients 33% of their votes, the same percentage as all voters. Republicans trailed with 19%. Who knew that Republicans were not fans of teacher unions?
Let’s go further. The chart below shows the percentage of voters in each party who cast their votes ONLY for candidates on the Apple Ballot.
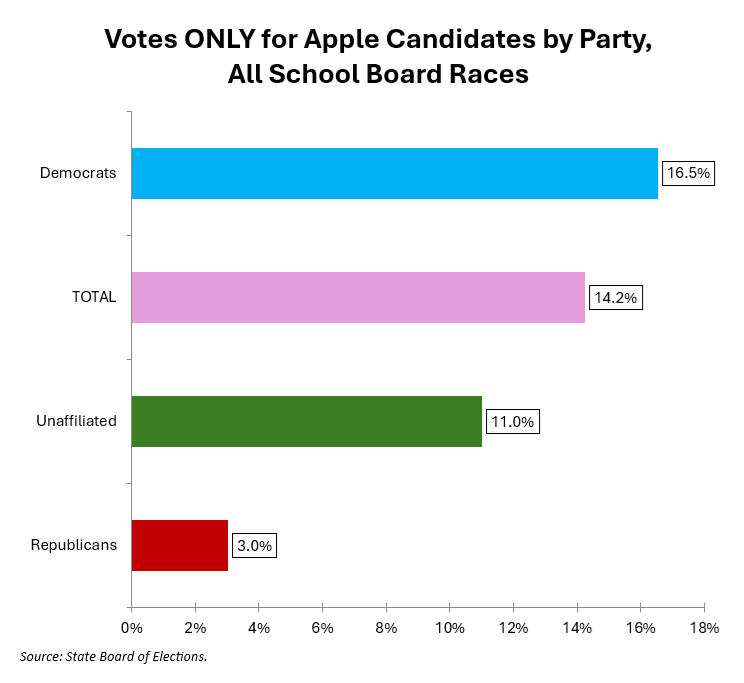
Here the differences are starker. 17% of the Democrats voted exclusively for Apple candidates, followed by 11% of unaffiliated voters and just 3% of Republicans.
Let’s quantify this in a different way. Presumably knowing little or nothing about these candidates other than their names and (in some cases) presence on the Apple Ballot, 22,562 Democrats, 752 Republicans and 1,162 other voters only picked Apple candidates. That is real power, and since it’s concentrated among Democrats, one can imagine its impact in partisan Democratic primaries.
At this point, the Apple has overshadowed incumbency and the alphabet in its effect on the 2024 school board race. However, some voters didn’t bother to vote for school board at all. We will learn more about them next.