By Adam Pagnucco.
Part One summarized the premise of this series: an examination of key stats from the U.S. Bureau of Economic Analysis (BEA) comparing Montgomery County to its largest neighbors. Part Two looked at population. Part Three looked at gross domestic product (GDP). Part Four looked at per capita GDP. Part Five looked at personal income. Part Six looked at per capita personal income. Part Seven looked at wage and salary employment. Part Eight looked at proprietors employment – jobs held by the self-employed. Part Nine looked at proprietors income. Now let’s examine real gross domestic product (GDP) from the construction industry.
BEA not only quantifies total GDP for the nation, states and counties – it also quantifies it by broad industry, which it calls industry accounts. BEA defines them this way:
A set of accounts that present the contribution of each private industry and government to the Nation’s gross domestic product (GDP). An industry’s contribution is measured by its value added, which is equal to its gross output minus its intermediate purchases from domestic industries or from foreign sources. The GDP-by-industry accounts are consistent with the annual input-output (I-O) accounts.
Of all the industries we could have picked, why construction? There are two reasons. First, building trades are an important place of employment for working class people and immigrants. While these jobs require significant training and skill, they don’t require expensive four-year university degrees. That makes them indispensable to large swaths of our population. Second and more importantly, the purpose of the construction industry is to build and maintain infrastructure. And that infrastructure – housing, commercial buildings, transportation projects, schools and more – is essential to economic growth. Localities that build a lot of this stuff are both reacting to economic growth and are setting the stage for even more growth to follow. In contrast, when construction declines, that’s often a symptom of broader economic decline.
It doesn’t hurt that I once worked for trade unions in this industry, so I am definitely biased towards it. Deal with it!
The chart below shows real GDP growth from the construction industry (adjusted for inflation) for eight large jurisdictions in the region in the most recent year measured. BEA does not release GDP from construction for the region, Frederick County or Prince William County, so instead of a regional comparison, we calculate the total for the eight remaining large jurisdictions shown below.
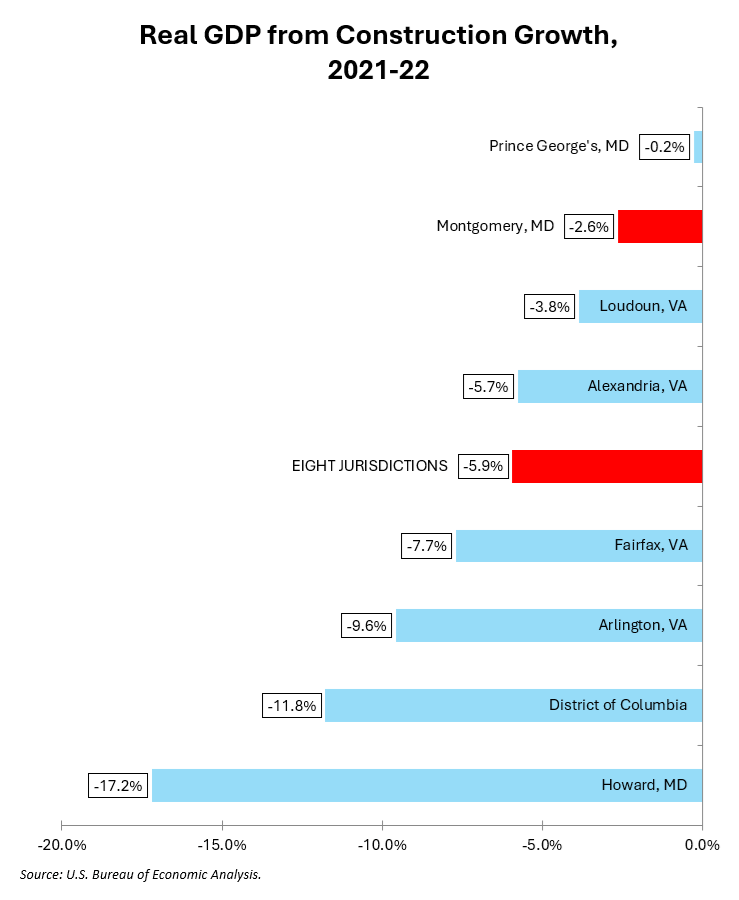
2022 was not a great year for construction activity in the region, but MoCo’s industry shrank at a lesser rate than all of its large neighbors aside from Prince George’s. (Again, stats for Frederick and Prince William are not available.) Shrinking less than competitors is good news, right?
Now let’s look at the five-year change.
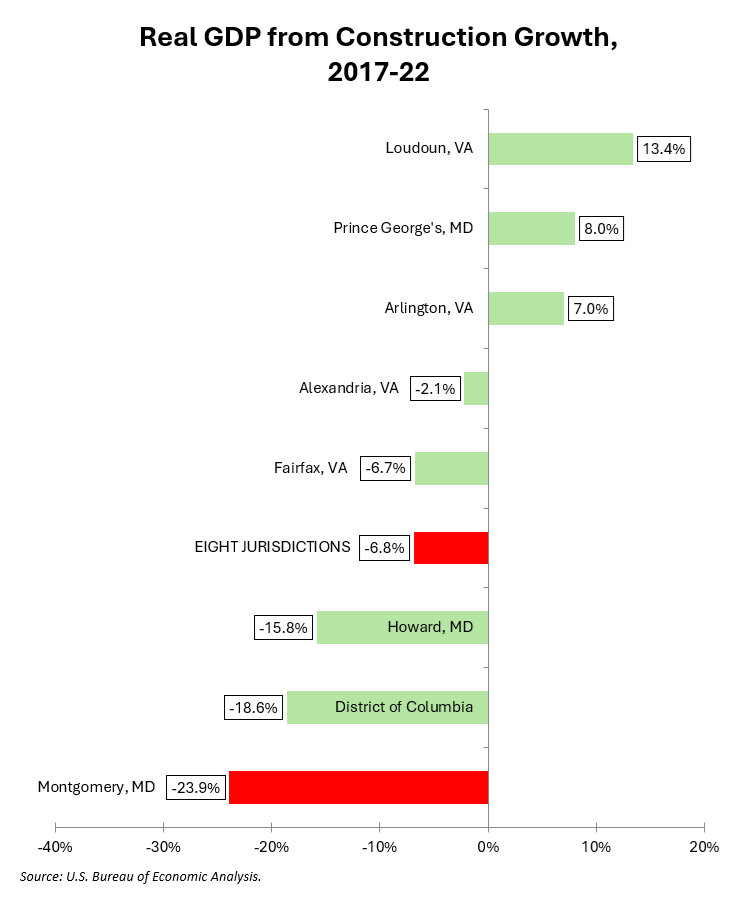
We lose big time. Most jurisdictions saw construction industry shrinkage but we were the worst.
This chart shows the ten-year change.
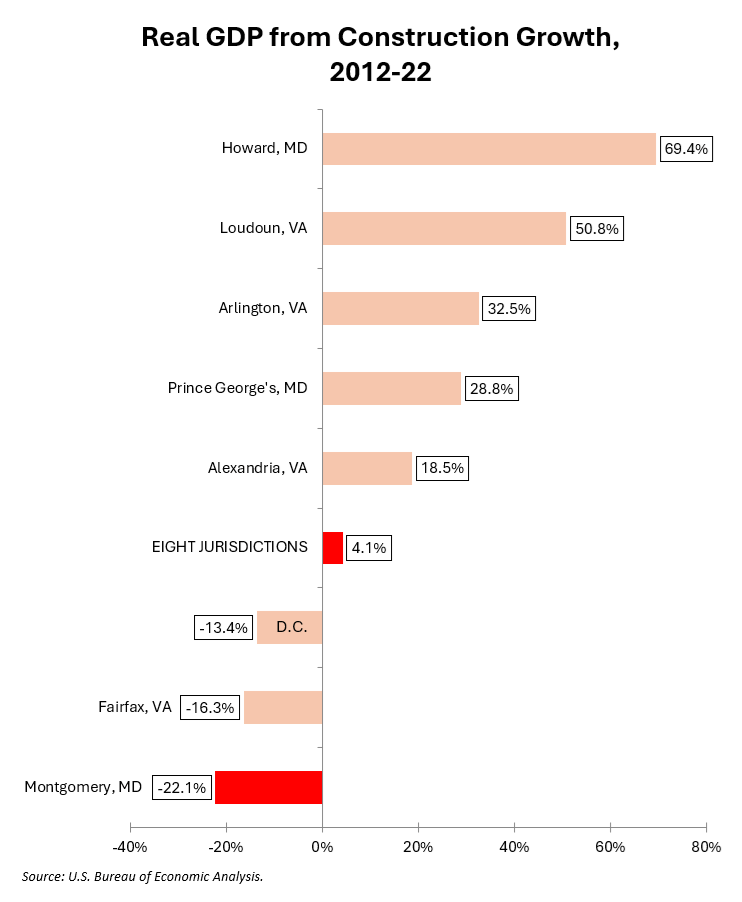
Again, MoCo is at the bottom.
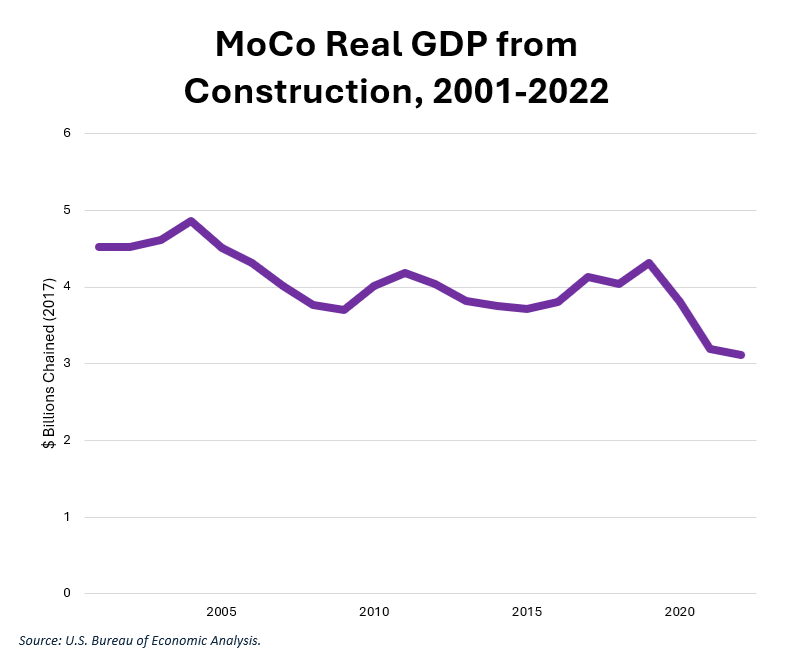
Let’s look at this in more detail. The chart below shows MoCo GDP from construction in real 2017 chained dollars since 2001. Roughly speaking, MoCo saw two plateaus interrupted by declines during the Great Recession and after 2019. The latter year was the last one before the pandemic.
Now let’s look at MoCo’s percentage of the eight large jurisdictions’ combined GDP from construction over the same period. With the exception of a temporary spike during the Great Recession (which affected other jurisdictions’ construction industries more than MoCo), MoCo accounted for nearly a quarter of the local construction economy. But that percentage dropped after 2019.
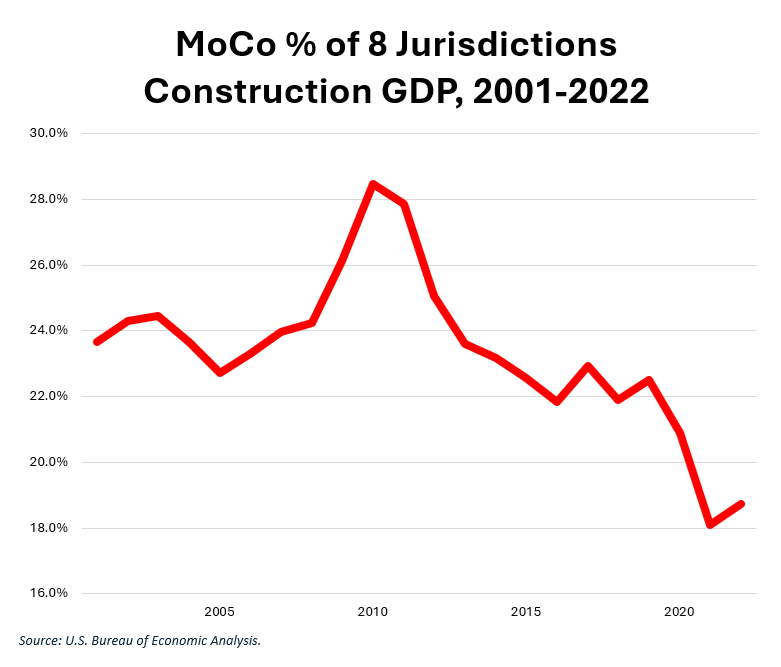
This decline in construction GDP, both relative and absolute, is troubling because it suggests a decline in infrastructure growth in the county. That’s not true of the entire region – Howard, Arlington, Loudoun and Prince George’s have seen substantial increases. (Frederick and Prince William have seen fast growth in recent years but are not tracked by BEA). If construction investment is not attracted to MoCo, what does that say about investors’ views of our economy?
Next: we will look at construction industry employment.
