By Adam Pagnucco.
Part One explained the context of this series and some characteristics of the IRS taxpayer migration data on which it relies. Part Two revealed that Maryland is the only U.S. state to rank in the top six in household income, the top three in education levels and the bottom third in income inequality. Part Three showed that Maryland has lost billions of dollars of adjusted gross income (AGI) in recent years. Part Four showed that a handful of jurisdictions – specifically Montgomery, Baltimore and Anne Arundel counties and Baltimore City – account for most of Maryland’s AGI losses to other states. Part Five found that departing high income taxpayers are exerting a disproportionate effect on Maryland’s wealth drain. Part Six demonstrated that Maryland’s wealth was primarily draining to a subset of states concentrated in the region and in the South. Part Seven looked at differences in the economies between Maryland and the states siphoning its taxpayer income. Today, let’s examine state income tax rates.
Maryland’s income tax structure is the elephant in the room because Governor Wes Moore proposed, and the General Assembly approved, two higher income tax rates for high earners. There will also be a 2% surcharge on capital gains income for those taxpayers with federal adjusted gross income of greater than $350,000. The Tax Foundation has found that Moore’s new top rate would far exceed the top rates of all of Maryland’s neighbors except for the District of Columbia. But that’s not quite the right test since not all of Maryland’s neighbors siphon its income. For example, Maryland regularly draws AGI out of D.C. A better test is how Maryland’s income tax rates compare to the Siphoning Seven – the group of seven states that have been drawing the most income out of Maryland over the last decade. Those states are – in order – Florida, North Carolina, Delaware, South Carolina, Texas, Virginia and Pennsylvania.
Before we begin, let’s go over a few notes of methodology.
Florida and Texas do not charge income taxes.
Delaware has a progressive income tax with a top rate of 6.6% applying to income of more than $60,000. The City of Wilmington, which accounts for 7% of the state’s population, charges a tax of 1.25% on gross wages.
North Carolina has a flat income tax rate of 4.25% this year. The state used to have a progressive income tax that topped out at 7.75% for incomes exceeding $60,000 but is now on track to cut taxes to a flat rate of 3.99% after 2025.
Pennsylvania has a flat state income tax of 3.07%. Its local governments charge additional income taxes. This analysis will include results for Philadelphia (added tax of 3.75%) and Pittsburgh (added tax of 3.0%).
South Carolina has a progressive income tax with a top rate of 6.2%. Its brackets are adjusted for inflation. In 2024, its top bracket kicked in at $17,330 in income.
Virginia has a progressive income tax with a top rate of 5.75% applying to more than $17,000 in income.
Maryland has progressive state income tax rates. Its county governments charge additional income taxes. A majority of them, including most of its largest jurisdictions (Baltimore City and Baltimore, Howard, Montgomery and Prince George’s counties) charge an additional 3.2% tax on income. This analysis will add 3.2% to Maryland’s state income tax rate to depict the most common rates paid by Maryland taxpayers.
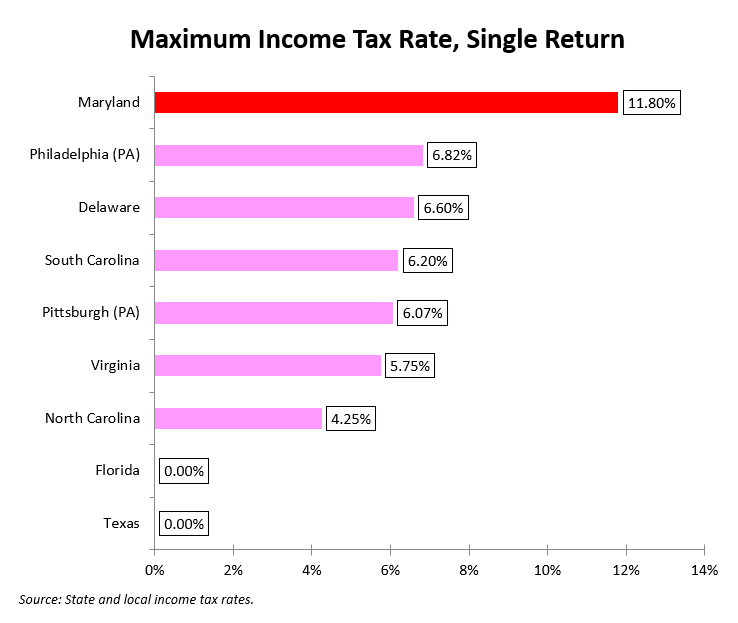
Bearing the above in mind, the chart below shows the marginal state and local rates paid by taxpayers filing single returns with just over $100,000 in income.
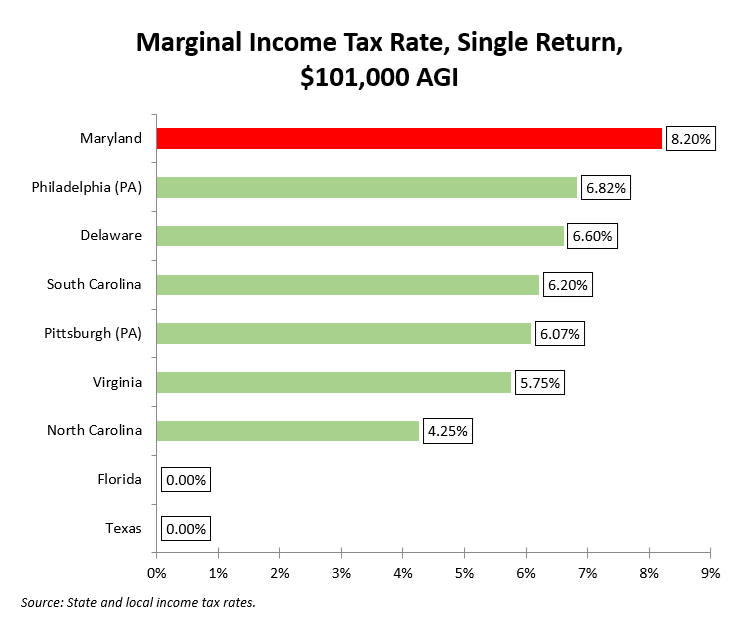
Maryland is the clear leader. The new rates would not change this.
Now let’s go to marginal rates applying to just over $250,000 in income.
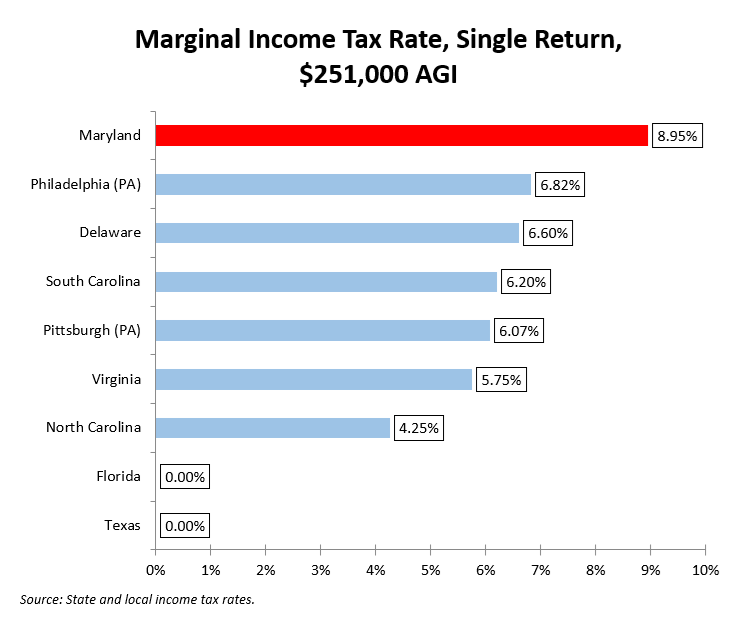
Again, Maryland is the clear leader. Maryland’s rate of 5.75% is the top rate under current law. Moore and the General Assembly added two more brackets. The chart below shows the single return state and local rates at just over $500,000. (Under the new rate structure, this rate would apply to joint returns of more than $600,000.)
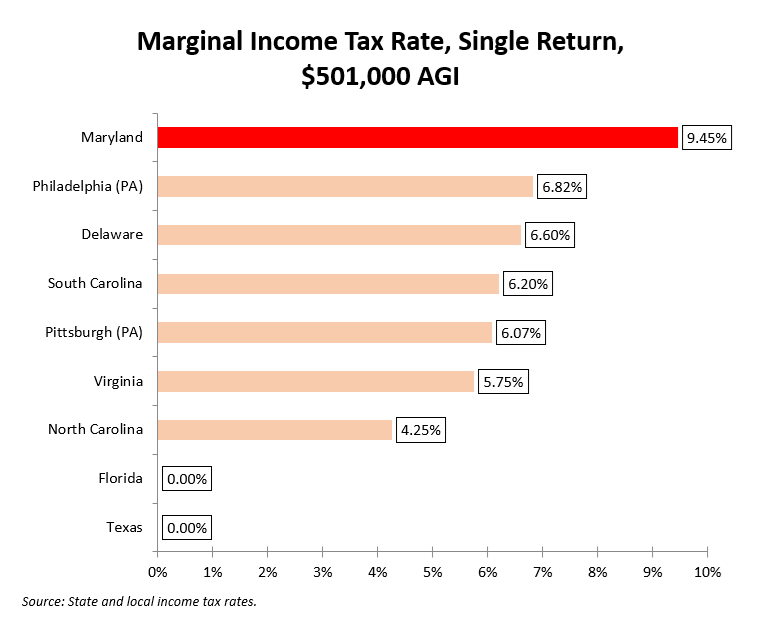
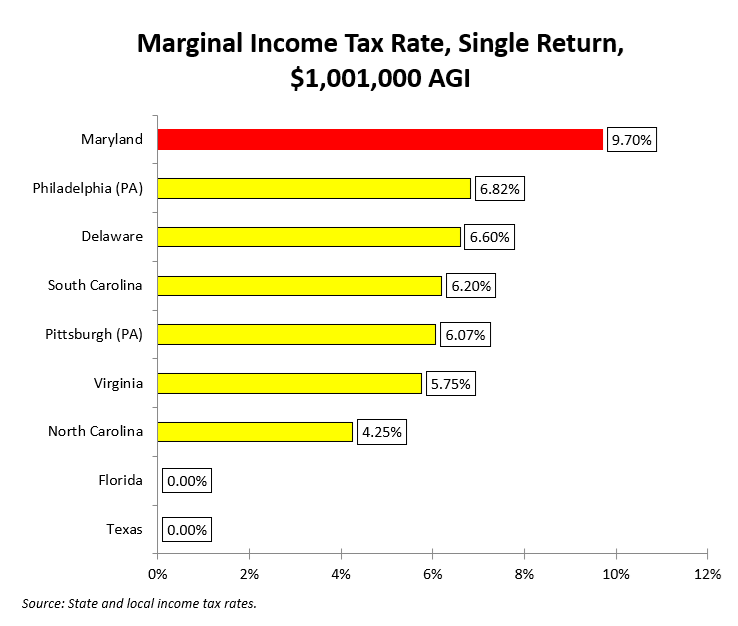
Maryland’s lead grows. The chart below shows the single return state and local rates at just over $1 million, the new highest bracket. (Under the new structure, this rate would apply to joint returns of more than $1.2 million.)
Let’s finish with this chart – the maximum combined state and county income tax rate. That includes the top rate shown above, the 2% surcharge on capital gains and the new 3.3% income tax rate that counties may now charge.
Put yourself in the shoes of one of these folks. Why would you live in Maryland?
Let’s summarize. Maryland has lost billions of dollars in taxpayer income to three of its neighbors (Delaware, Virginia and Pennsylvania) as well as a group of Southern states (Florida, North Carolina, South Carolina and Texas) under its existing tax structure. As recounted in Part Five, that departing wealth is concentrated among high earners. How much more will Maryland lose by raising taxes on those same high earners?
By passing both higher income tax brackets and the capital gains surcharge, Maryland’s leaders have closed their existing budget gap, but only for the moment. Under current projections, state budget deficits resume within two years. And if this year’s tax hikes accelerate Maryland’s already growing loss of taxpayer income, the state could very well face an even bigger budget crisis down the road.
And with thousands more high income taxpayers out the door, what then?