By Adam Pagnucco.
The county’s public financing law has one stipulation on geography: contributions from individuals who live in the county are eligible for public matching funds while contributions from non-residents are not. That implies potentially equal roles for all of Montgomery County’s geographic sub-components.
But that has not been the case in actual practice. Some areas have actively participated in contributing to publicly financed candidates while others have not. That amplifies pre-existing differences in political participation between local areas in the county.
Let’s revisit two posts on Democratic turnout in the 2022 primary that I wrote shortly afterwards. The charts below show turnout rate by local area and precinct demographics last year. For definitions of the terms used in these charts, see my methodology post.
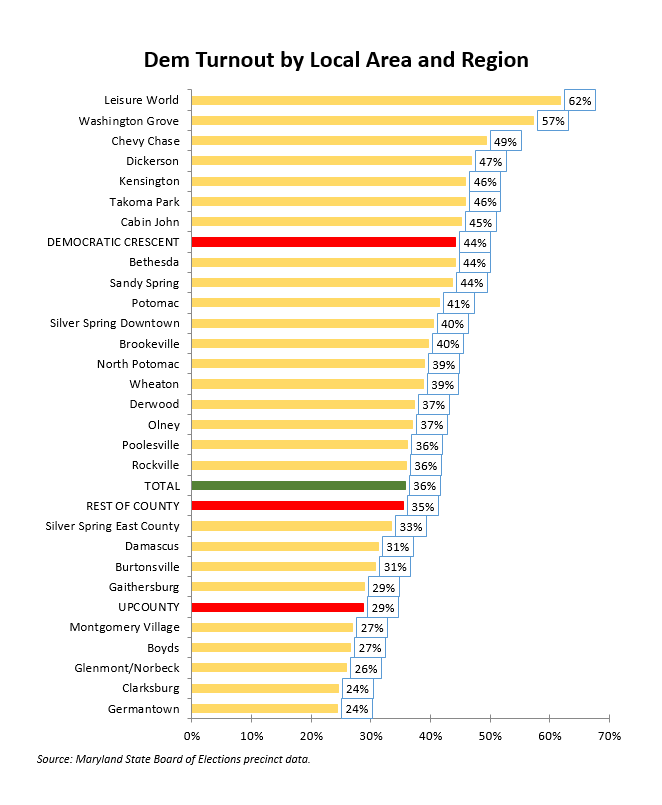
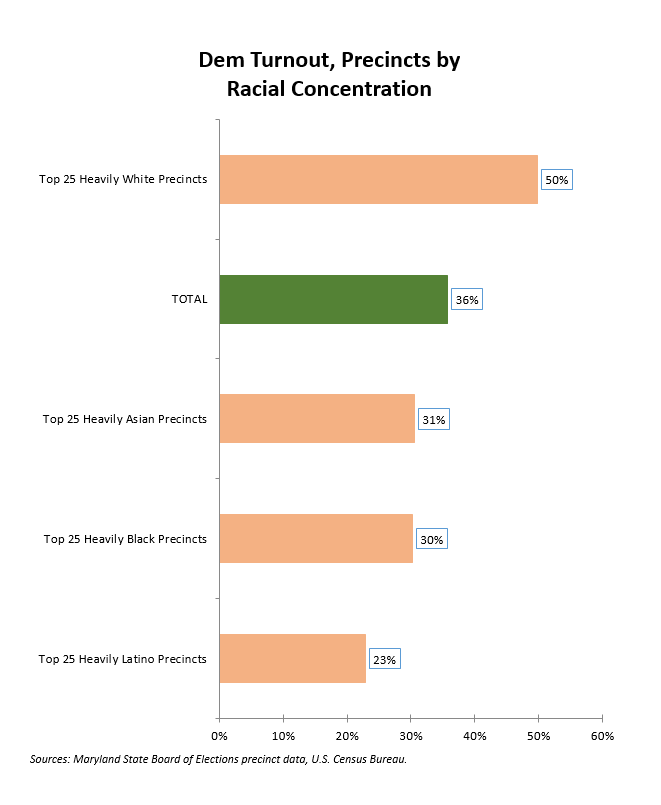
Precincts that are Downcounty and heavily White have much higher turnout than precincts that are Upcounty and have high percentages of residents of color. That was not merely the case in 2022. I have seen that pattern in every election I have studied here.
Bearing that in mind, check out the pie chart below showing individual in-county contributions by region of residence.
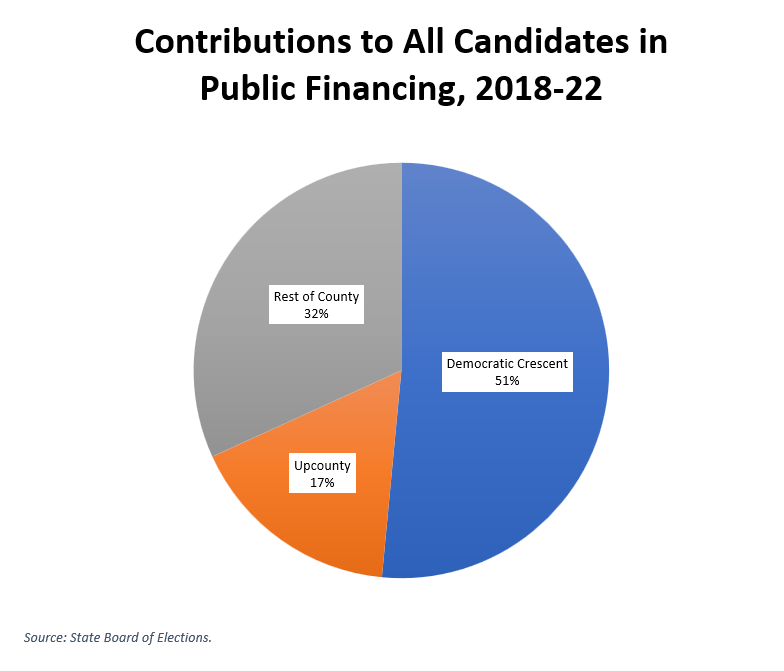
An absolute majority of contributions to all races came from the Democratic Crescent, the areas inside and near the Beltway that elected Jamie Raskin to Congress in 2016. That’s despite the fact that the crescent has less than a quarter of the county’s population. In per capita terms, the crescent contributed $6.06 per resident to publicly financed candidates, Upcounty contributed $1.32 and the rest of the county contributed $2.02.
Downcounty dominates turnout and it also dominates contributions in public financing.
None of this is surprising. Our politics has long revolved around the wishes of Downcounty residents and activists. Public financing is merely reinforcing a long-time trend.
Let’s dig a little deeper. The pie chart below shows individual in-county contributions by region of residence for county executive candidates in public financing.
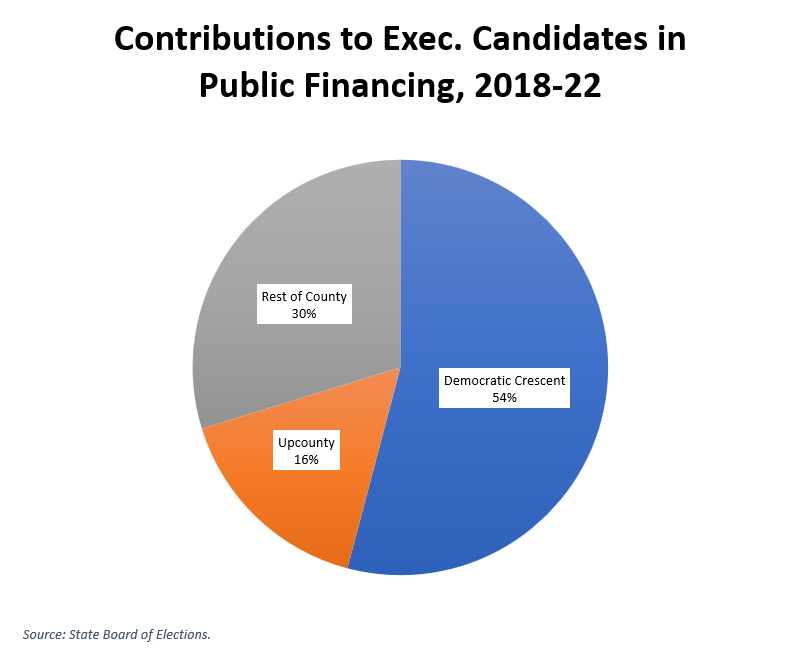
Let’s remember that of the five candidacies in the system (Marc Elrich in 2018 and 2022, George Leventhal and Rose Krasnow in 2018 and Hans Riemer in 2022), four came from Downcounty residents. Krasnow, a former Mayor of Rockville, is the exception.
Now let’s look at the same data for council at-large candidates.
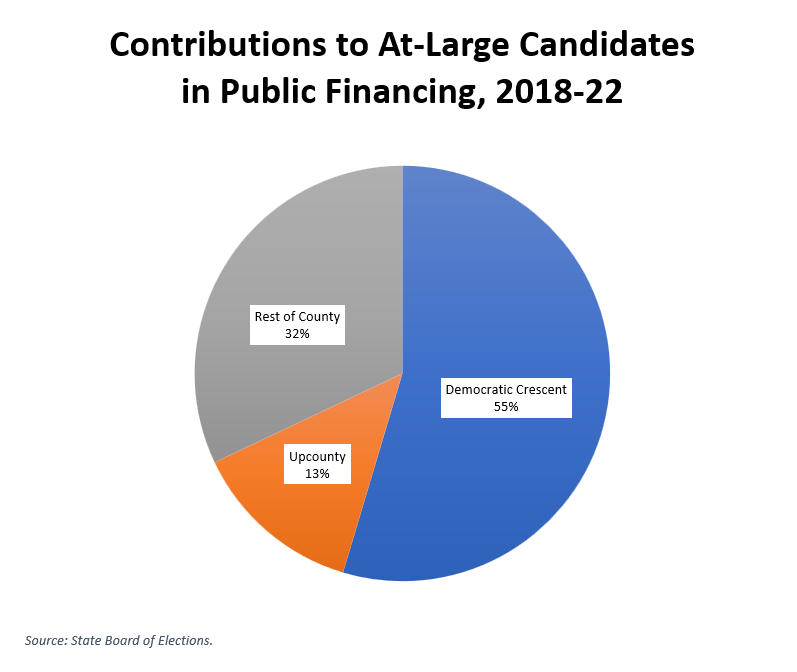
The distributions among region for executive and council at-large candidates are very similar. If turnout by itself were not reason enough to focus countywide candidates on Downcounty, contributions in public financing emphasize it even more. When your votes and your money are coming from the same place, you have a lot of incentive to treat that place well.
We will have more in Part Five.
