By Adam Pagnucco.
In Part Six, we looked at per capita contributions by local area. Let’s expand that analysis to demographics.
The U.S. Census Bureau collects demographic data on 46 zip codes in Montgomery County. We may not have demographic data on each individual contributor, but since we know the demographics of where they live, we can make inferences on what kinds of people are contributing in public financing.
Let’s start with Asian residents. The chart below reports per capita in-county individual contributions by zip code percentage of Asian residents from the 2017-21 American Community Survey. Zip codes with the highest Asian percentages are 20841 in Boyds (47%), 20871 in Clarksburg (37%), 20878 in Gaithersburg (27%), 20850 in Rockville (25%) and 20866 in Burtonsville (24%). Zip codes with the lowest Asian percentages are 20838 in Barnesville, 20839 in Beallsville, 20862 in Brinklow, 20889 in Bethesda and 20899 in Gaithersburg, all estimated by Census to be close to zero.
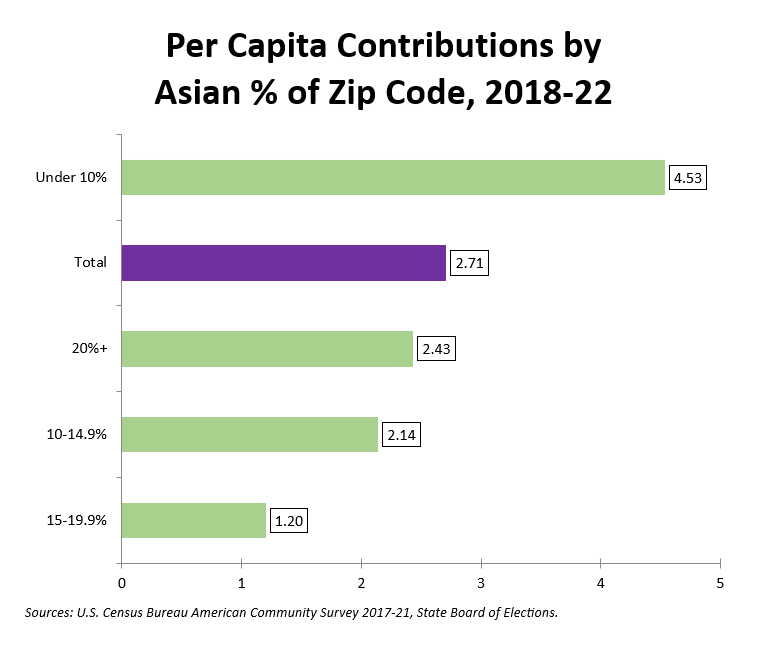
Zip codes with the lowest Asian percentages had the highest per capita contribution rates. Part of this was driven by Takoma Park, Kensington and western Bethesda, which all have low Asian population percentages and lots of contributions.
Now let’s look at per capita in-county individual contributions by zip code percentage of Black residents. Zip codes with the highest Black percentages are 20899 in Gaithersburg (78%), 20904 in Silver Spring East County (47%), 20866 in Burtonsville (45%), 20912 in Takoma Park (37%) and 20876 in Germantown (31%). Zip codes with the lowest Black percentages are 20868 in Spencerville (2%), 20812 in Glen Echo (1%), 20896 in Garrett Park (1%), 20838 in Barnesville (close to zero) and 20839 in Beallsville (close to zero).
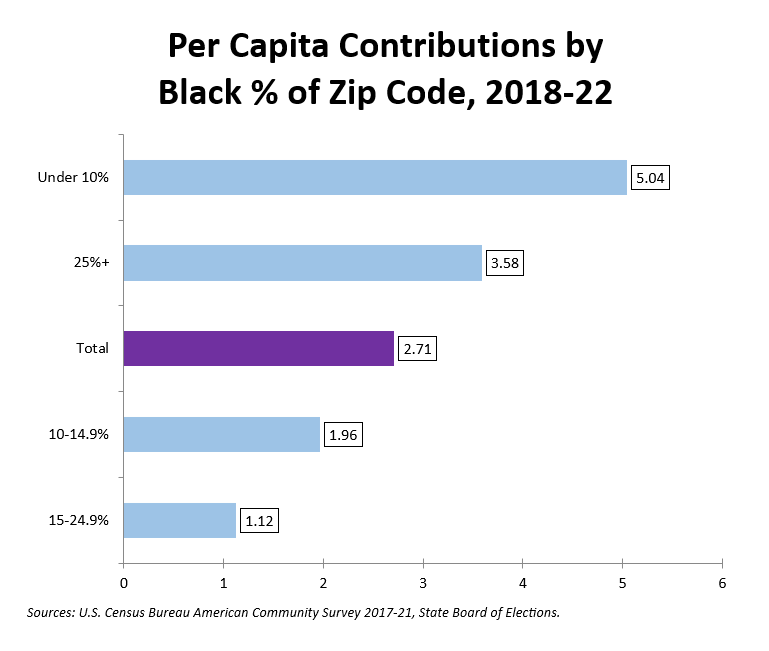
Zip codes with high Black percentages had above average contribution rates. This was driven primarily by Takoma Park and Downtown Silver Spring, which have large Black populations. But the highest contribution rates are in zip codes with few Black residents. This is largely due to lots of contributions from Bethesda, Kensington and Potomac, where the Black percentage is 6% or less.
Finally, let’s look at per capita in-county contributions by zip code percentage of Latino residents. Zip codes with the highest Latino percentages are 20868 in Spencerville (62%), 20903 in Silver Spring East County (52%), 20877 in Gaithersburg (42%), 20902 in Wheaton (39%) and 20851 in Rockville (39%). Zip codes with the lowest Latino percentages are 20880 in Washington Grove (6%), 20818 in Cabin John (5%), 20899 in Gaithersburg (4%), 20896 in Garrett Park (3%) and 20839 in Beallsville (close to zero).
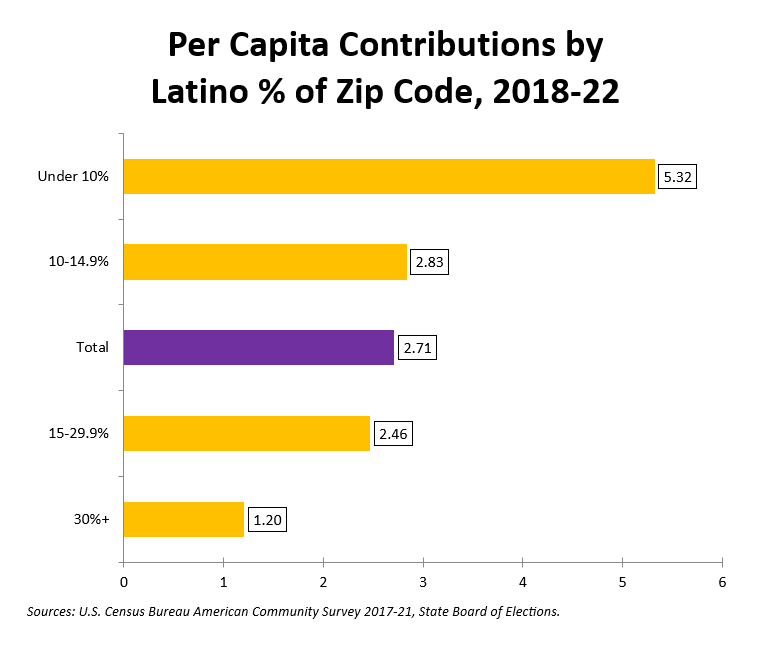
Here the correlation is clear: rising Latino percentage is associated with falling per capita contributions. That’s partly due to high contribution rates in Chevy Chase, Bethesda and Potomac, which have low Latino percentages, and low contribution rates in eastern Gaithersburg, Montgomery Village and Glenmont/Norbeck, which have high Latino percentages.
So zip codes with high Asian, Black and Latino population percentages disproportionately do not contribute to publicly financed candidates. In Part Eight, we will find out what kinds of zip codes are more likely to contribute.