
By Adam Pagnucco.
Part One covered the methodology of this series. Let’s get started by looking at data from the U.S. Bureau of Labor Statistics on total employment in the D.C. region’s ten largest jurisdictions.
First, let’s look at total employment in MoCo since 2001, the first year in the series. It has hovered around 450,000 payroll jobs for a long time, falling during the Great Recession, rising afterwards and falling again during the pandemic. The preliminary job count in 2025 (456,246) is down from last year and is slightly below the level of 20 years ago (458,809). That means we have had twenty years of essentially no job growth.

Now let’s look at change in total employment from 2024 to 2025 by jurisdiction. This captures the first year of President Donald Trump’s second administration.
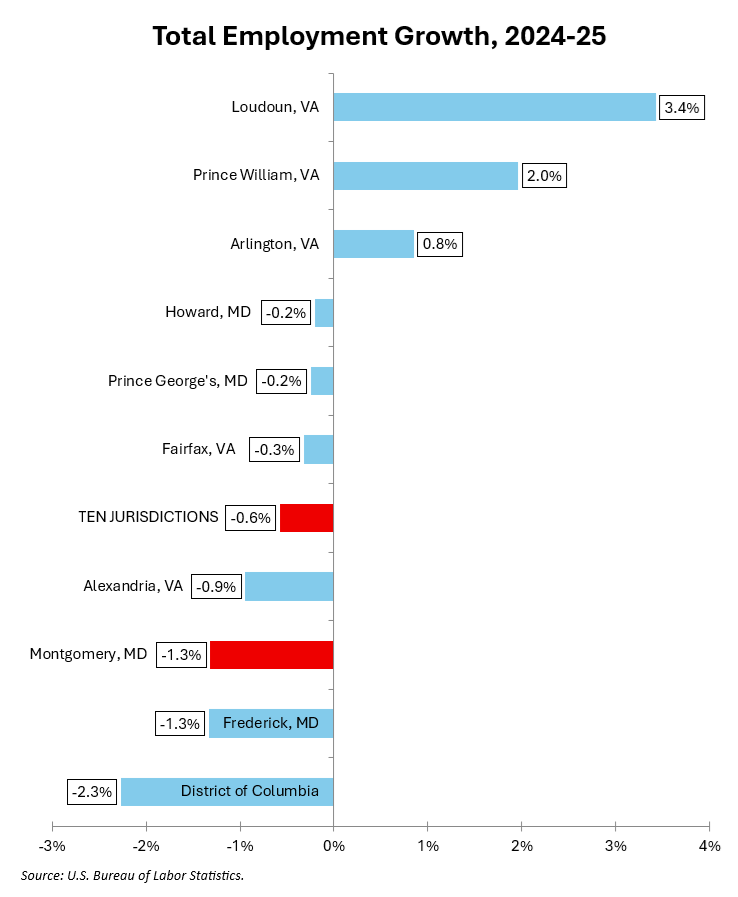
Seven of the ten largest DC area jurisdictions lost jobs last year. We were hurt worse than most. Remember, these are total jobs, not just federal government jobs. This stat makes me wonder whether the DC metro area suffered an actual recession last year.
The chart below shows 2025 total employment as a percentage of 2019 total employment. Essentially, it shows the extent to which each jurisdiction’s jobs base has recovered from the pandemic.

MoCo is one of five big jurisdictions in the region that has not regained its jobs base from before the pandemic.
Finally, the chart below shows total employment change from 2007 – the year before the Great Recession – to last year. This is equivalent to two business cycles of data.
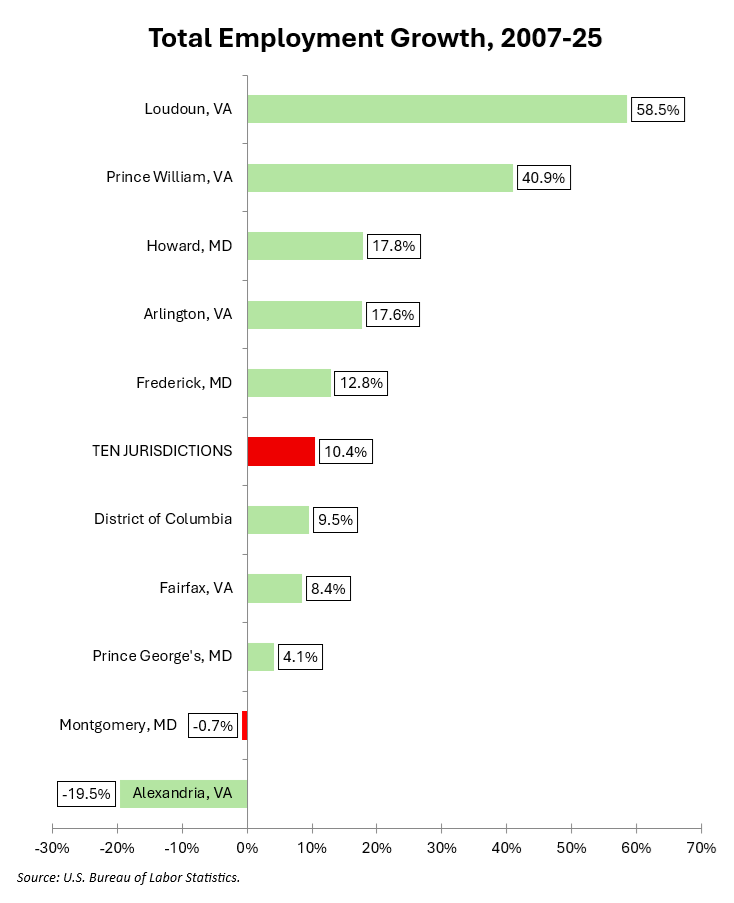
MoCo is only one of two jurisdictions shown that has lost jobs since the pre-Great Recession peak. Only Alexandria, the region’s weakest jurisdiction, trailed us.
Local politicians blame Trump for job losses, and over the past year, they are probably right. But this data shows that we have been deficient on this measure for decades.
Next: federal government employment.