By Adam Pagnucco.
While the COVID-19 crisis has affected virtually everyone in the nation, it has not affected everyone equally. In a project for the Council for Advocacy and Policy Solutions, I analyzed COVID-19 infection rates by Maryland zip code to determine which demographic and economic factors were most associated with the spread of the virus. Many factors had some correlation, but none of the ones I examined had more of a correlation with COVID-19 than the Latino percentage of population.
For each of the more than 400 zip codes in Maryland, I collected the following data:
COVID-19 cases on 6/18/20
Average total income per tax return
Population per square mile
Median age
Percent Hispanic (any race)
Percent white non-Hispanic
Percent black
Percent Asian
Percent of population age 25 and older with less than high school graduate level of education
Percent of population age 25 and older with graduate and/or professional degree
Percent of population age 5 and older who speak a language other than English at home
I then used four techniques to identify correlations between each of these factors and the number of COVID-19 cases per 1,000 residents.
5 category comparison
For each factor, five categories ranging from low to high were measured. For example, for median age, COVID-19 cases per 1,000 residents were estimated for median ages of under 35, 35-39.9, 40-44.9, 45-49.9 and 50 or older.
Correlation coefficient
A correlation coefficient measures the correlation between two variables. A coefficient of 1.0 means that the two are perfectly and positively correlated. A coefficient of -1.0 means that the two are perfectly and negatively correlated. A coefficient of 0.0 means that the two are uncorrelated.
R-squared
R-squared measures the percentage of variation in one variable explained by the variation of a second variable. An R-squared of 100% means that 100% of the variation in one variable is explained by variation of a second variable. An R-squared of 0% means that 0% of the variation in one variable is explained by variation of a second variable. Unlike the correlation coefficient, R-squared cannot be negative and therefore does not indicate whether the correlation between two variables is positive or negative.
X-Y chart
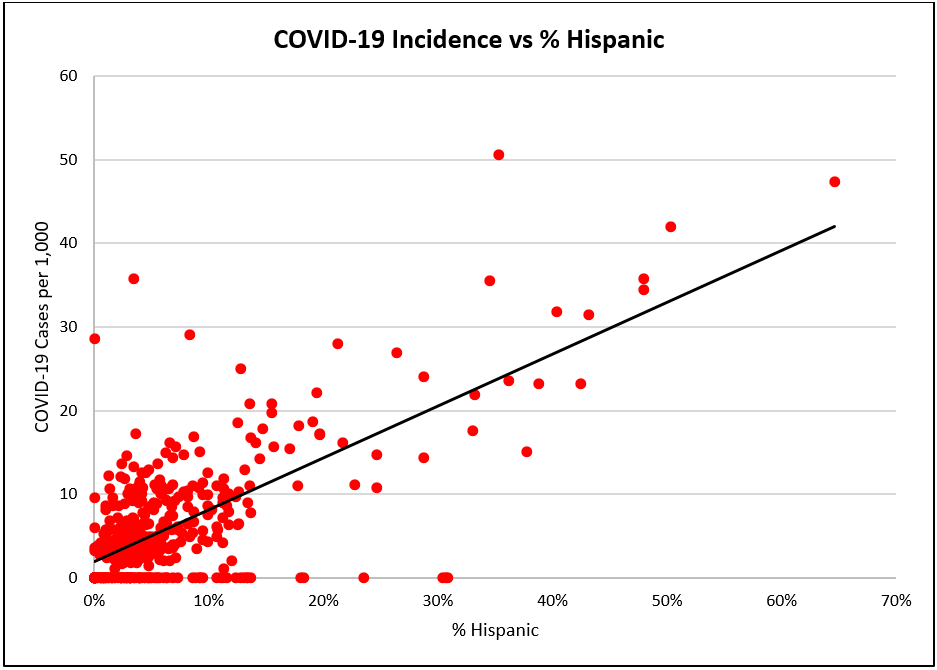
Each data point is plotted on a chart with the x-axis representing one variable and the y-axis representing another. A line of best fit is also shown summarizing the correlation between the two variables.
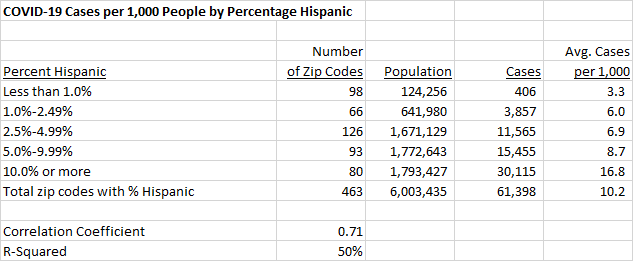
Among the factors I studied, none had a stronger correlation with infection rate by zip code than the Hispanic/Latino percentage of the population. The summary table appears below.

As the Hispanic percentage of the population rises, so too does the infection rate. Maryland zip codes in which Hispanics account for 10% or more of the population had infection rates roughly five times greater than zip codes in which Hispanics accounted for less than 1% of the population. Overall, roughly half of the variation in infection rates among Maryland zip codes was explained by Hispanic percentage alone.
The chart below shows the distribution of zip code data points. The vertical axis plots the number of COVID-19 cases per thousand residents as of 6/18/20. The horizontal axis plots the Hispanic percentage of each zip code’s population. The association is not perfectly linear but the trend is plain.

The data do not demonstrate why this association exists. A possible reason might be heavy Latino presence in essential sectors like agriculture, food manufacturing, grocery stores, warehouses and delivery, all of which have heightened risks of virus exposure. Relatively low health insurance coverage exacerbates the issue.
The second highest correlation I found with infection rates was the percent of population age 5 and older who speak a language other than English at home. This factor is closely associated with the Hispanic population percentage.
Many of the other factors I examined had some correlation with infection rates although none of them were quite as strong as percentage Hispanic. This has a clear implication for policy makers: dealing with COVID-19 requires special attention to this demographic. If the virus spreads unchecked in this community, no other community will be safe.
The entire study, including results for other factors, can be found here.
