By Adam Pagnucco.
Age is the biggest difference between MoCo Democrats who always vote in gubernatorial general elections and those who don’t. Here are a few other differences.
Household Income
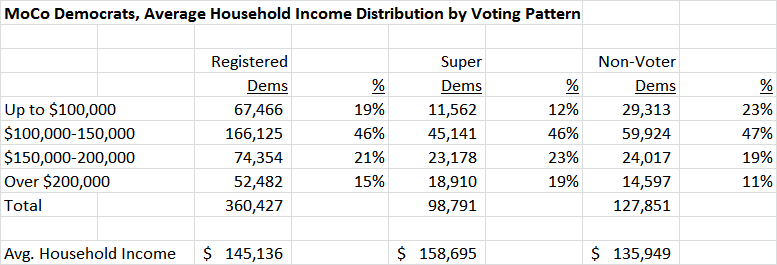
The voter registration file contains the addresses of all registered voters. The Census Bureau tracks household income over the 2009-2013 period by zip code, municipality and owner vs renter status. We integrated Census income data with the voter file and found these voting patterns.

Super-Dems and non-voters can be found in every income group but there is a correlation between voting and income. The average household income of super-Dems is 17% higher than non-voters. Super-Dems are more likely to have household incomes of $200,000 or above (19%) than are non-voters (11%). Conversely, non-voters are more likely to have household incomes of under $100,000 (23%) than super-Dems (12%).
Geography
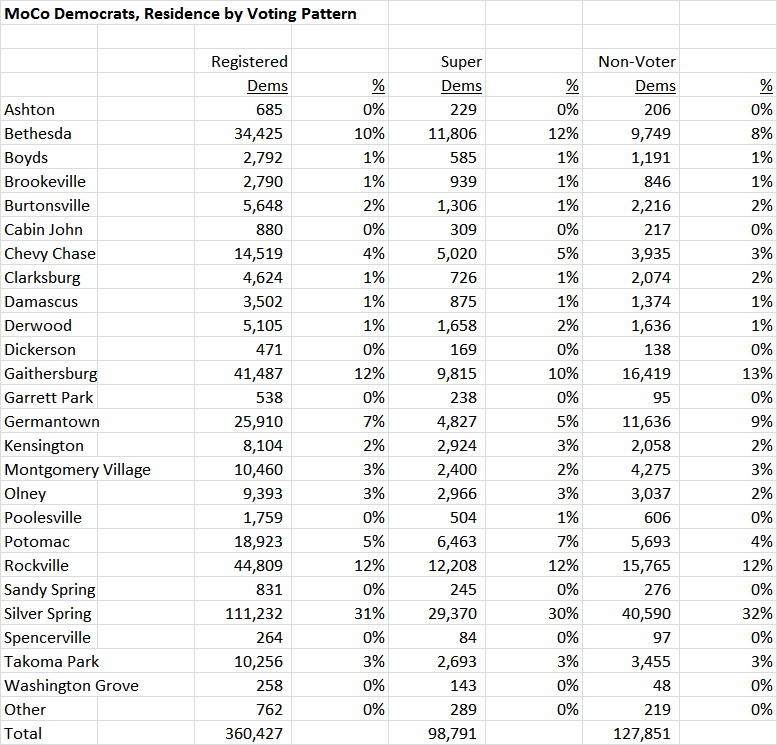
Super-Dems and non-voters also tend to have different residence patterns. Below are their distributions by city and town.

Super-Dems are most likely to live in Kensington, Chevy Chase, Bethesda and Potomac, in that order. Non-voting Dems are most likely to live in Germantown, Clarksburg, Montgomery Village and Gaithersburg, in that order.
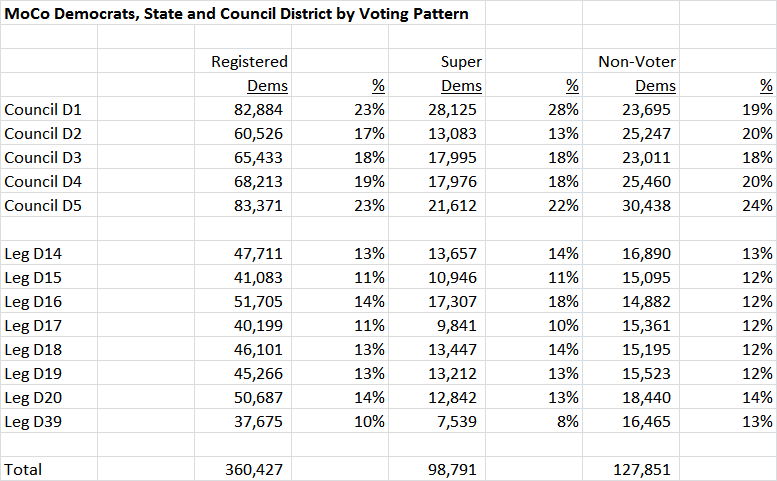
Below is the same data presented by council and legislative district.

Super-Dems are most likely to live in Council District 1 and Legislative District 16 – again, in the BCC-Potomac vicinity. Non-voting Dems are most likely to live in Council District 2 and Legislative District 39, which contain Germantown and Montgomery Village.
Race
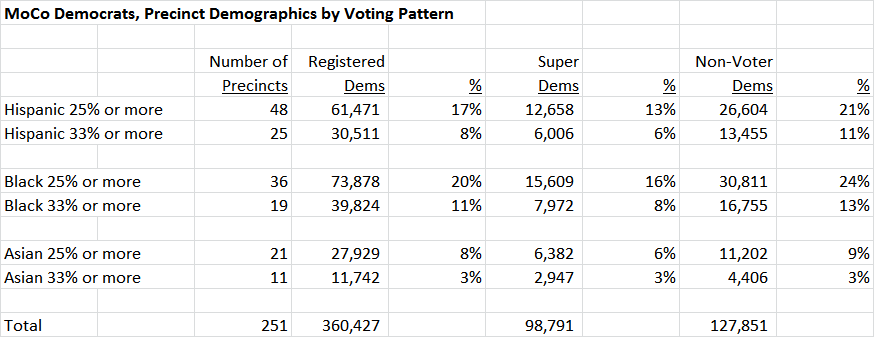
The voter file does not contain racial data. But the Census Bureau does have racial data by Census tract, and we integrated that into the voter file. Below is the distribution of super-Dems and non-voters in the precincts that have the highest percentages of black, Hispanic and Asian residents.

Voting patterns in Asian precincts don’t vary much. But non-voters are significantly more likely to live in precincts with high black and Hispanic populations than super-Dems.
In summary, the following characteristics apply to super-Dems in order of likelihood. Super-Dems are most likely to:
- Be age 60 or over
- Be age 50-59
- Live in Kensington
- Have average household incomes of $200,000 or more
- Live in Chevy Chase
- Live in Bethesda
- Live in Potomac
- Live in Council District 1
Non-voting Dems are most likely to:
- Be age 39 or younger
- Live in Germantown
- Live in Clarksburg
- Live in precincts that are 33% or more Hispanic
- Live in Legislative District 39
- Have average household incomes of less than $100,000
- Live in precincts that are 33% or more African American
- Live in Council District 2
How can the non-voting Dems be turned into voting Dems? We will conclude with a few suggestions to do that in Part Four.
