By Adam Pagnucco.
A new report by a state office illustrates a fact that’s not a big surprise: cannabis prevalence varies a lot across Maryland. Let’s examine its areas of abundance and scarcity.
Maryland’s Office of Social Equity was established by the state’s Cannabis Reform Act of 2023, which codified the voters’ approval of cannabis legalization in 2022. Last month, the office issued a report containing the results of a survey it ran on residents’ preferences for the use of state revenues from cannabis sales. The report contained data on cannabis charges by county from January 1, 2002 through January 1, 2023. This data governs distributions from the state’s Community Reinvestment and Repair Fund (CRRF) to the counties. Here is the methodology statement.
Twenty-year cannabis charge data was used to determine the distribution of funds to counties as part of the CRRF. The Maryland Judiciary and Administrative Office of Courts provided two datasets with cannabis charges covering the periods of July 1, 2002 through December 31, 2009 and January 1, 2010 through January 1, 2023. The datasets were cleaned separately prior to combining them into a final, 20-year dataset for analysis. Data cleaning steps included: removal of out-of-state addresses, addresses identified as correctional facilities, persons listed as homeless, missing zip codes, non-possession and non-cannabis charge records. Data cleaning removed approximately 10% of records from each dataset.
The remaining addresses were verified through the United States Postal Service Application Programming Interface (API) in RStudio. Invalid addresses were corrected using the validated code or removed if too little detail was available to validate. The final combined dataset contained 252,961 records. Counties were imputed by geocoding the validated address data using the ArcGIS Online for Maryland geocoding service and then performing an inner join intersection with the Maryland County Boundaries feature layer created by the Maryland State Data Center.
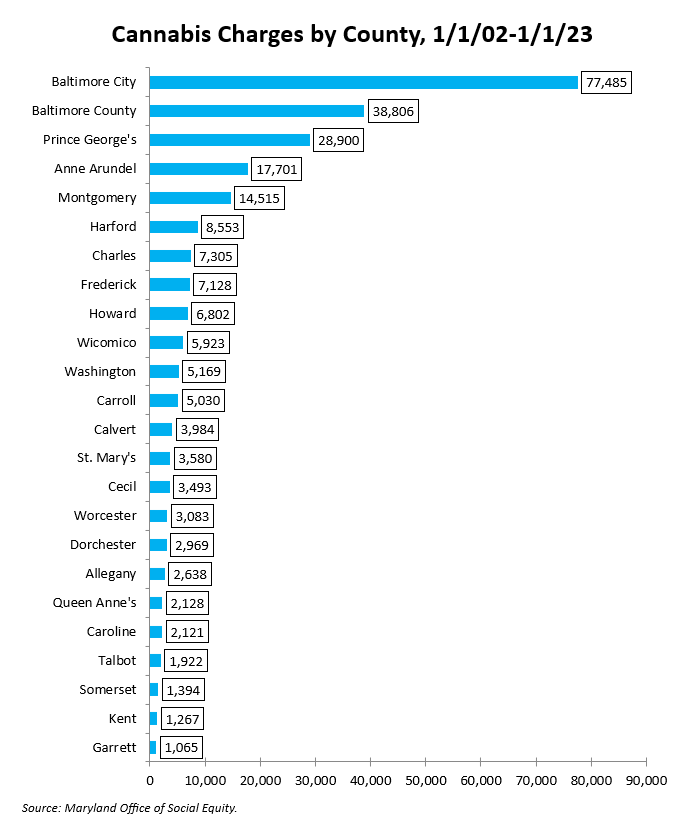
Here is the number of cannabis charges by county over the past two decades.
Now let’s remember that there are vast differences in county populations. For example, Montgomery County has more than a million residents while Kent County has less than 20,000. The chart below shows the charge count per hundred residents using the U.S. Census Bureau’s 2022 5-year American Community Survey (ACS) as a population measure.
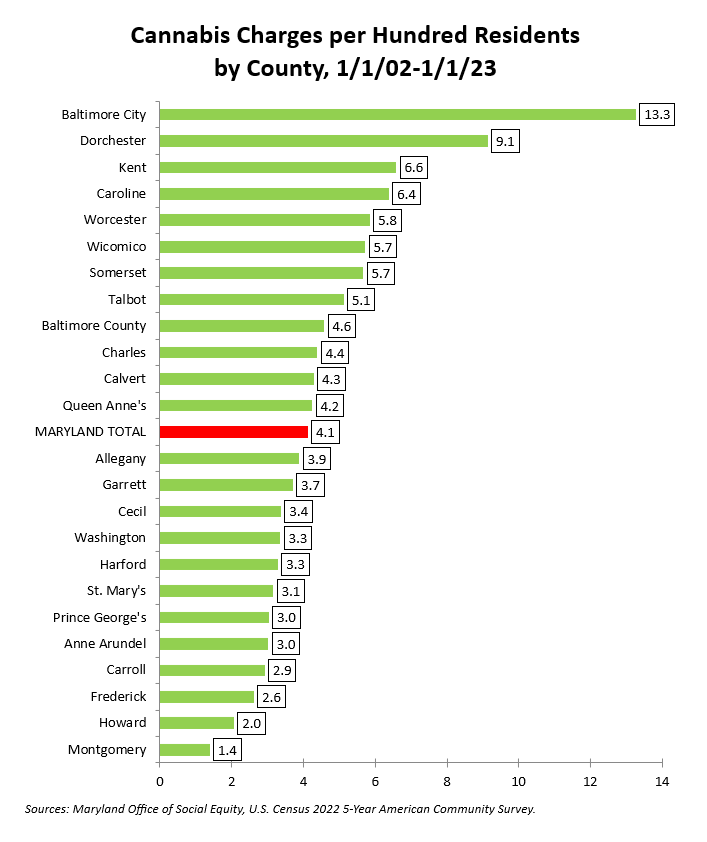
Baltimore City is the runaway leader while Howard and Montgomery counties lag. What explains this? Household income seems to be one factor. The scatter chart below shows county median household incomes from the 2022 5-year ACS on the vertical axis and charges per hundred residents on the horizontal axis. The red line is the line of best fit. The relationship between the two is negative.
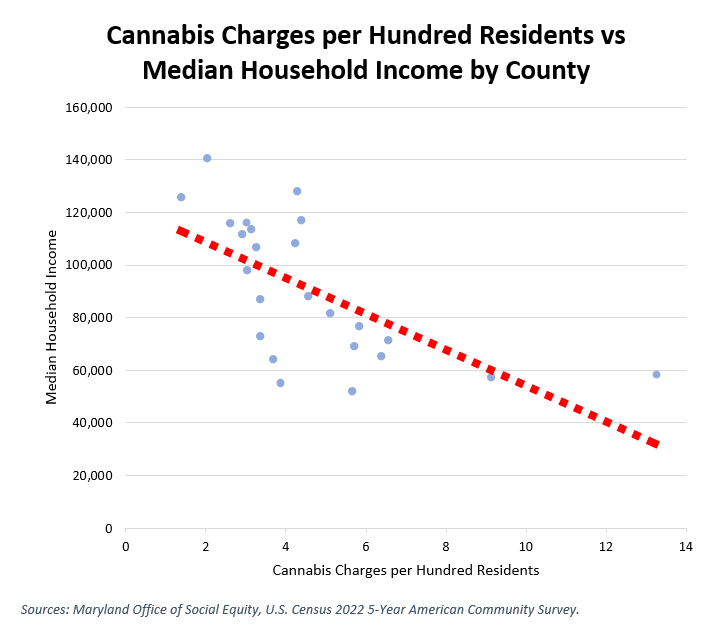
Let’s summarize this with a correlation coefficient, which measures the correlation between two variables. A correlation of +1.0 is a perfect positive relationship between the two while a correlation of -1.0 is a perfect negative relationship. The correlation coefficient between charges per hundred residents and median household income is -0.64, indicating a moderate negative relationship.
What about race? There are two local jurisdictions that are roughly 60% Black – Baltimore City and Prince George’s County. Baltimore City is the leader in this dataset with 13.3 charges per hundred residents. Prince George’s County, on the other hand, has just 3.0 charges per hundred residents, below the state average of 4.1. The other jurisdiction with a large Black population is Charles County, which is 48% Black. It has recorded 4.4 charges per hundred residents, which is close to the state average.
The correlation coefficient between charges per hundred residents and Black percentage of the population is +0.46, a moderate positive correlation. However, when Baltimore City is removed from the calculation, the coefficient drops to +0.12, which is a very weak positive correlation. It’s clear that the city skews this data, and without it, Black percentage of population is not a significant predictor of cannabis charges.
Now let’s acknowledge that charges do not equate with possession. They reflect police enforcement practices too. Have Baltimore City police more rigorously enforced cannabis laws than Prince George’s County police? We can’t rule that out. However, let’s also note that Baltimore City’s median household income ($58,349) is much lower than Prince George’s County’s ($97,935). There is a bit of research correlating cannabis use with low educational attainment and low income as well as other demographic factors.
One reason why the Office of Social Equity conducted its research on cannabis charges is that they are used to determine the distribution of cannabis revenues shared by the state with the counties. However, the counties are not getting a lot of money out of cannabis legalization. Only 5% of state cannabis money goes to counties and municipalities, a local revenue share that the Maryland Association of Counties claims is the smallest in the nation. The comptroller’s office recently reported that the state collected $12.2 million of cannabis revenues from July through September 2023. Of that amount, just $607,927 went to counties and municipalities. Let’s remember that it’s local and municipal police departments who are mostly responsible for responding to incidents of driving under the influence of cannabis.
One final thing about cannabis money. The state’s cannabis dashboard shows cannabis sales by month. Since the state’s cannabis market began in July, total cannabis sales have been stable at roughly $90 million a month, of which about $55 million was for recreational use. This revenue source does not appear to be growing. Applying a 9% sales tax to the adult use volume would yield roughly $60 million for the state annually. That’s a tiny fraction of the state’s $27 billion general fund. There is a good policy argument to be made for cannabis legalization – and two-thirds of the state’s voters agreed with it – but from a fiscal perspective, it provides little more than a rounding error in state and local budgets.