By Adam Pagnucco.
In Part Two, we learned that Maryland is the only U.S. state to rank in the top six in household income, the top three in education levels and the bottom third in income inequality. That’s the good news. The bad news is that we are losing taxpayer income to net out-migration.
The U.S. Internal Revenue Service (IRS) maintains a data series of in-migration and out-migration of taxpayers by state and county since 1991. For each state and county, the IRS tracks the number of returns entering, leaving and staying for each year; the number of exemptions entering, leaving and staying each year; and the amount of adjusted gross income (AGI) entering, leaving and staying each year. The IRS also reports the origin and destination of migration by state and county. The data is about as user-friendly as quantum mechanics, but if you battle enough downloadable spreadsheets, you can start to see patterns.
Let’s start by looking at Maryland’s inflow and outflow of tax returns by year. The chart below shows those flows since 1993, with outflow in red and inflow in blue.
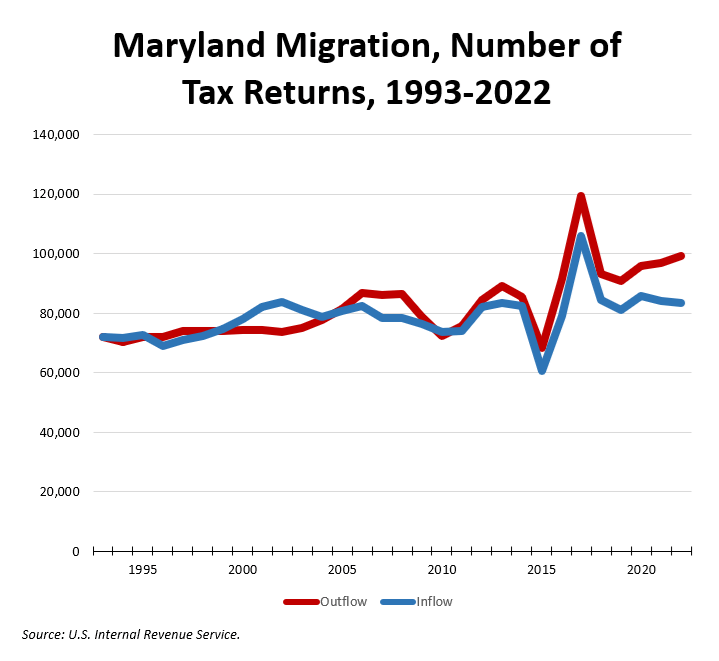
The data contains a drop and spike in 2015-17, a pattern I have seen with the county data I analyzed in 2018 and 2023. I’m not sure what glitch caused it, but it appears to have washed out over the three year period.
The chart below shows net outflow of returns over the period. Negative values indicate net inflow.
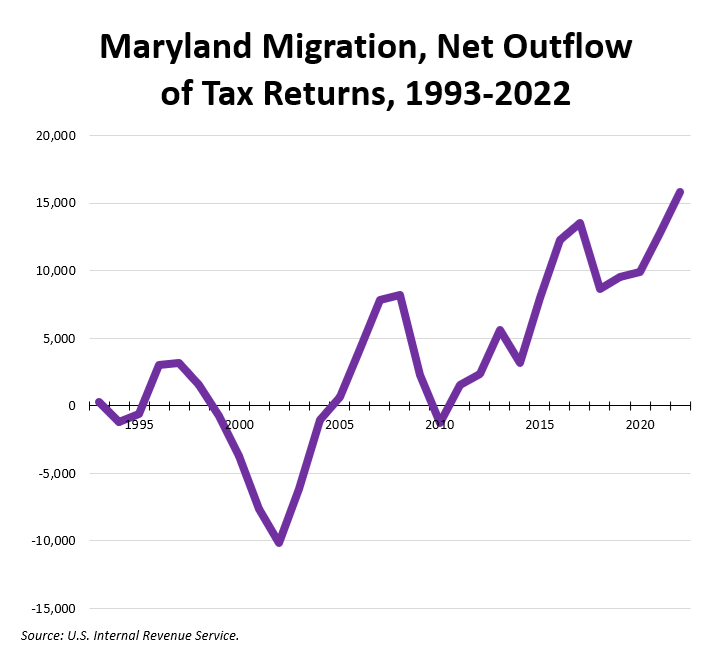
Maryland has not always had net-outmigration of taxpayers. During 1999-2004, the state saw substantial in-migration. But in the years since then, the state has seen more taxpayers leave than enter in every year but one. A positive balance of births and deaths continued to add population for most of that period.
Now let’s look at Maryland’s inflow and outflow of adjusted gross income (AGI), which has been adjusted for inflation using 2022 dollars. The chart below shows those flows since 1993, with outflow in red and inflow in blue.
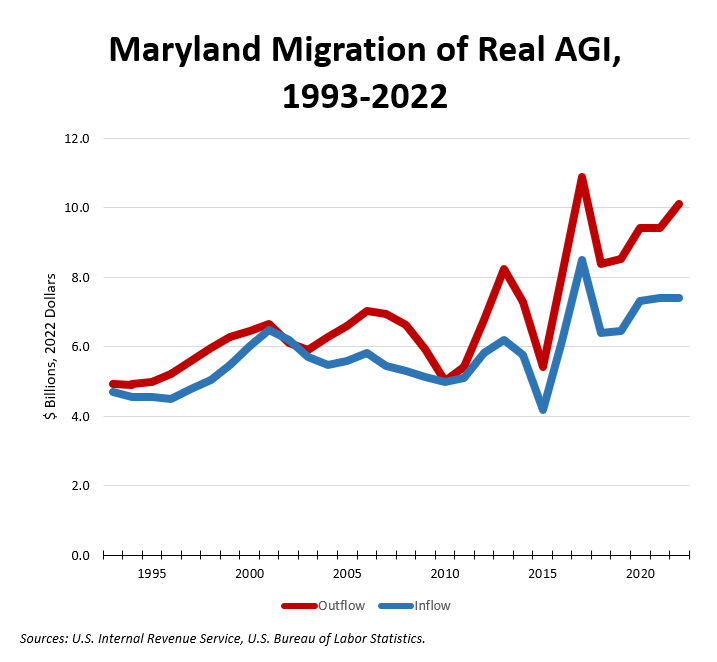
Again, we see the 2015-17 dip and spike. (What’s going on there, IRS?) We also see that outflow usually exceeds inflow. The chart below shows the net outflow of AGI over the period.
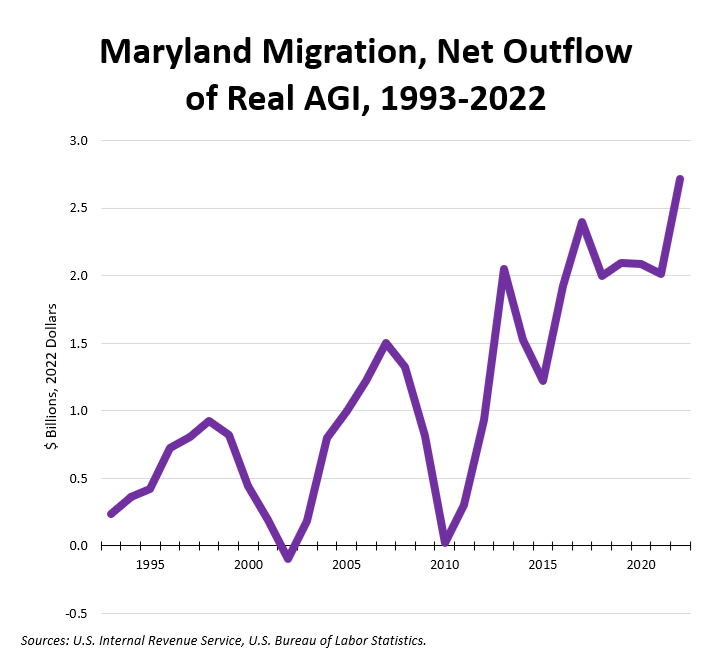
Except for 2002 (the year after a recession), Maryland has lost AGI to migration for almost three decades. And the pace of that loss has accelerated. From 2017 through 2022, Maryland lost $2.0-2.7 billion in AGI each year, the only period in the series that has happened. The pandemic may have something to do with this, but let’s note that three of those years – 2017, 2018 and 2019 – occurred before the pandemic. Clearly, there is more to this than just COVID migration.
Migration patterns differ inside the state. We will examine those patterns next.