By Adam Pagnucco.
Part One explained the context of this series and some characteristics of the IRS taxpayer migration data on which it relies. Part Two revealed that Maryland is the only U.S. state to rank in the top six in household income, the top three in education levels and the bottom third in income inequality. Part Three showed that Maryland has lost billions of dollars of adjusted gross income (AGI) in recent years. Part Four showed that a handful of jurisdictions – specifically Montgomery, Baltimore and Anne Arundel counties and Baltimore City – account for most of Maryland’s AGI losses to other states. Today let’s look at the incomes of migrants.
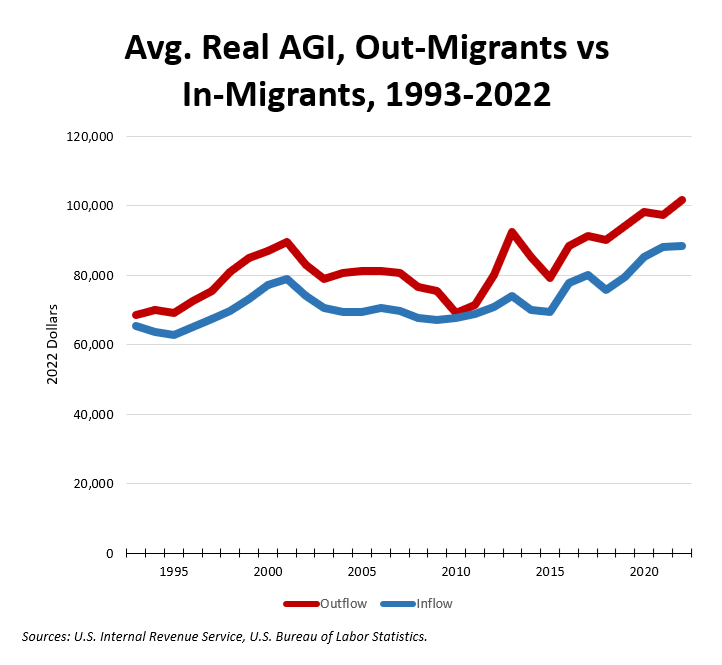
Back in 2023, I found that the average AGI of out-migrants from Montgomery County always exceeded the average AGI of in-migrants. The chart below shows how those incomes compare for out-migrants and in-migrants in Maryland. Amounts are adjusted for inflation using 2022 dollars.

From 2012 through 2022, the average AGI of out-migrants has exceeded the average AGI of in-migrants by a range of $9,103 to $18,393 per year. In percentage terms, that’s a range of 10-25%. Clearly, the people leaving Maryland make more money than the people moving into Maryland. That’s part of the state’s wealth challenge.
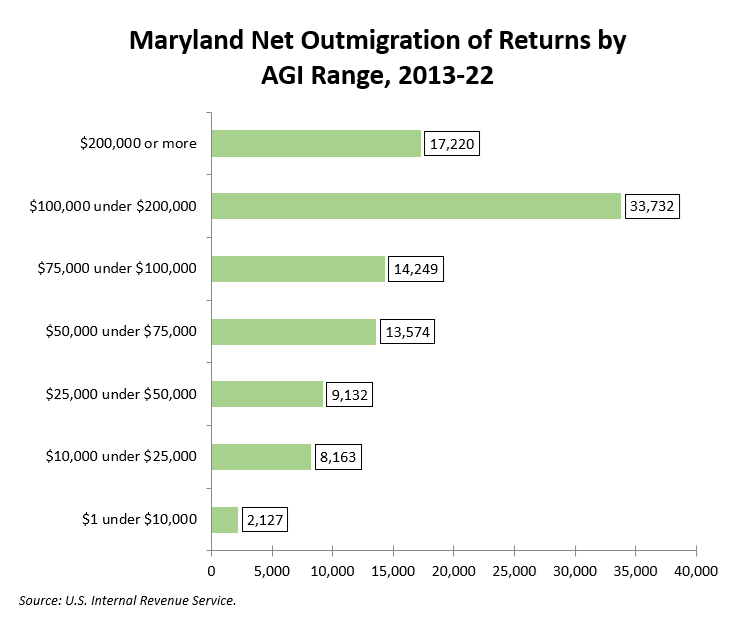
IRS taxpayer migration data is available by income ranges for states, which is not the case for counties. The chart below shows Maryland’s net out-migration of tax returns by income range over the most recent decade, 2013-22.

In terms of number of returns, those making at least $100,000 accounted for 52% of all those leaving over the period.
The disparity is even more clear when comparing the number of departing returns to the number of non-migrants in 2022. For returns of $200,000 or more, the out-migrants leaving in the prior decade comprised 6.9% of the non-migrants in 2022. The comparable figures were 1.6% for returns of less than $10,000, 2.7% for returns of $10,000-25,000 and 1.8% for returns of $25,000-50,000. This means that wealthy people have been leaving the state at much higher rates than low-income people over the last decade.
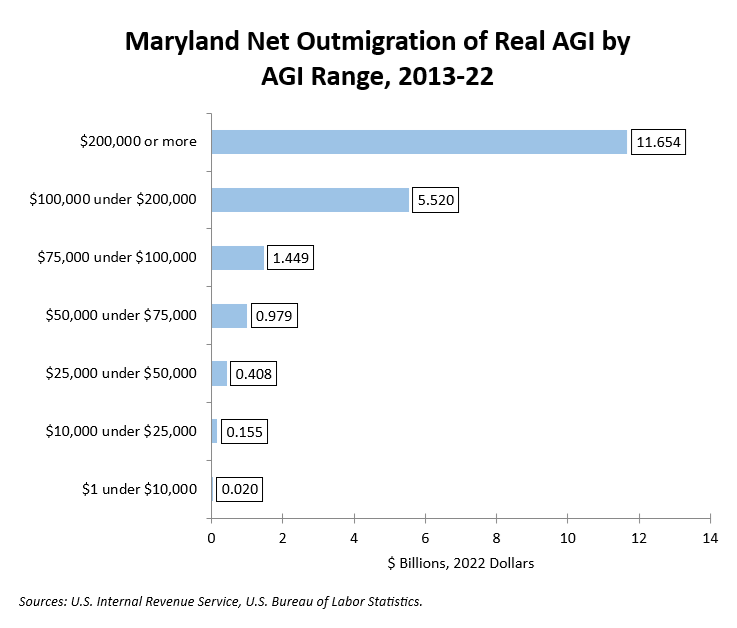
Now let’s look at adjusted gross income (AGI). The chart below shows Maryland’s net out-migration of AGI by income range over the most recent decade, 2013-22. The amounts are adjusted for inflation and expressed in 2022 dollars.

58% of Maryland’s lost income came from returns of at least $200,000. Another 27% came from returns of $100,000-200,000. Departing high income taxpayers are exerting a disproportionate effect on Maryland’s wealth drain.
Now let’s compare the amount of departing AGI to the amount of non-migrant AGI in 2022. For returns of $200,00 or more, the out-migrant AGI of the prior decade comprised 9.6% of the non-migrant AGI in 2022. The comparable figures were 2.9% for returns of less than $10,000, 2.9% for returns of $10,000-25,000 and 2.2% for returns of $25,000-50,000. Again, wealthy taxpayers are moving their income out of Maryland at greater rates than low-income people.
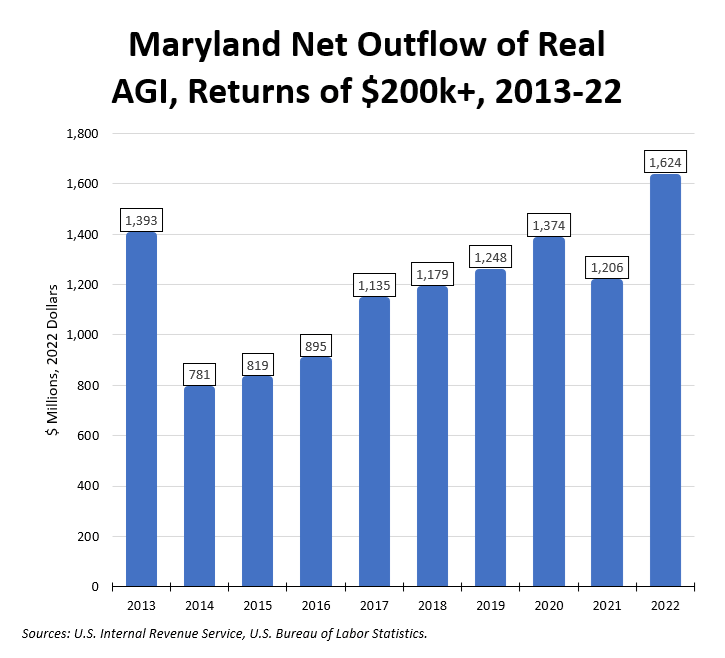
Let’s finish by looking at the net outmigration of AGI in returns earning $200,000 or more. The chart below shows annual net outmigration of income for this group measured in real 2022 dollars. The outflow among high earners is accelerating.

This data also conforms to one of the principal findings of Part Four, which is that Montgomery County leads Maryland in lost taxpayer income due to net out-migration. While IRS data does not break out income ranges for counties, this suggests that the flight of Montgomery County’s wealthy population is a problem for the state’s collection of income taxes.
Where are out-migrating Maryland taxpayers going? We will find out in Part Six.
