By Adam Pagnucco.
Part One explained the context of this series and some characteristics of the IRS taxpayer migration data on which it relies. Part Two revealed that Maryland is the only U.S. state to rank in the top six in household income, the top three in education levels and the bottom third in income inequality. Part Three showed that Maryland has lost billions of dollars of adjusted gross income (AGI) in recent years. Part Four showed that a handful of jurisdictions – specifically Montgomery, Baltimore and Anne Arundel counties and Baltimore City – account for most of Maryland’s AGI losses to other states. Part Five found that departing high income taxpayers are exerting a disproportionate effect on Maryland’s wealth drain. Part Six demonstrated that Maryland’s wealth was primarily draining to a subset of states concentrated in the region and in the South. Today, let’s try to explain that.
Let’s call the states to whom Maryland is losing the most taxpayers and AGI the Siphoning Seven. Three of them – Delaware, Virginia and Pennsylvania – are in the Mid-Atlantic region. Four of them – Florida, North Carolina, South Carolina and Texas – are in the South. Why are these states siphoning taxpayer income from Maryland? This post examines three differences in state economies.
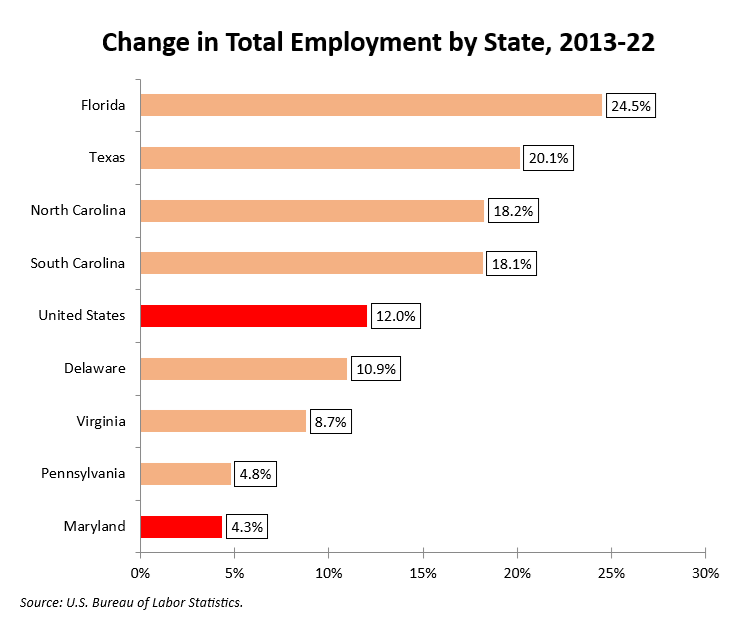
The chart below shows the change in total employment from 2013 through 2022 for Maryland and the Siphoning Seven. That was the same period used to examine flows of returns and AGI in Part Six. Aside from Pennsylvania, all of these states had job bases that were growing much more rapidly than Maryland’s.
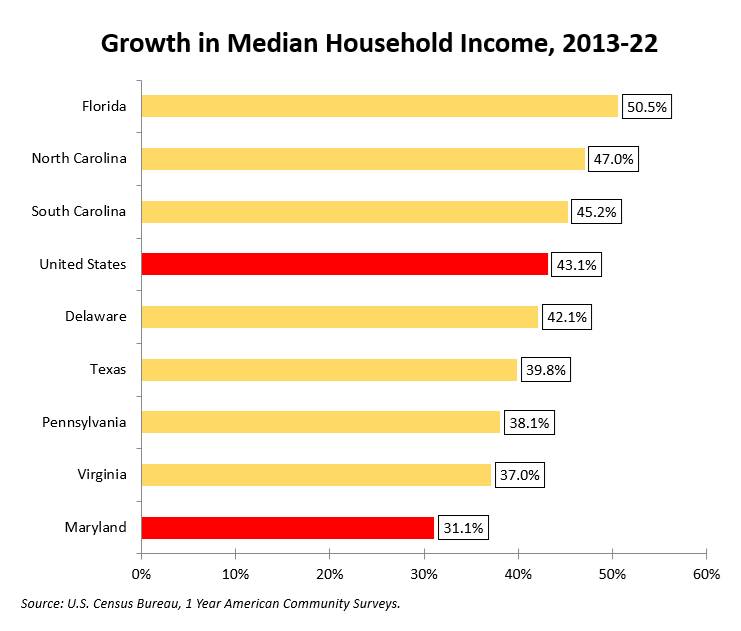
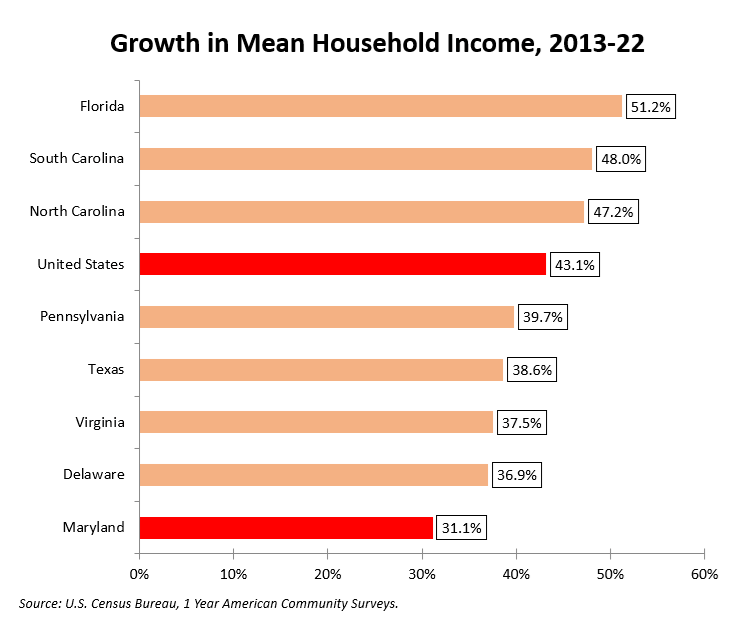
The charts below show changes in median and mean household income for Maryland and the Siphoning Seven from 2013 through 2022. All of these states had more rapid income growth than Maryland, with Florida and the Carolinas leading the pack.
Finally, let’s examine cost of living. The U.S. Bureau of Economic Analysis calculates regional price parities for states, which it defines as “the differences in price levels across states and metropolitan areas for a given year and are expressed as a percentage of the overall national price level.” The United States is set at 100.0, with costlier states exceeding that figure and cheaper states falling below it. The chart below shows how Maryland and the Siphoning Seven compared on this measure in 2023.
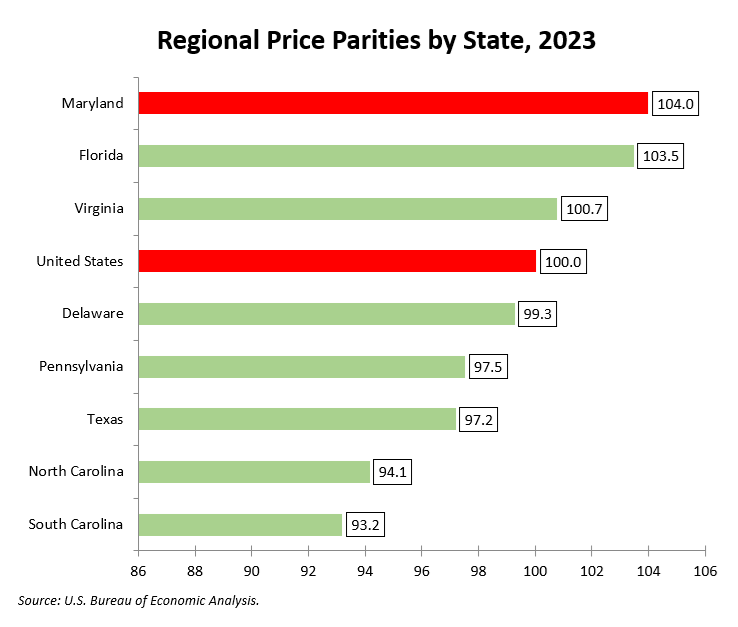
Other than Florida, the Siphoning Seven have cheaper costs of living than Maryland – especially the Carolinas.
The combination of stronger job growth, higher income growth and lower costs of living are helping these states steal taxpayer income from Maryland. But that’s not all. We will look at income tax rates next.