By Adam Pagnucco.
Since April, MCPS has been gathering data on community feedback for its boundary study and program analysis proposals. But so far, the responses it has received are so wildly skewed that they may not produce any useful results at all.
Consider these data points from MCPS’s Secondary Program Analysis and Boundary Studies Community Engagement Plan Update, which was released to the school board on June 24. The full presentation is available for download at the end of this column but let’s consider three pages in detail.
Page 6, shown below, shows the results of FLO Community Survey #1 in April. I wrote about this survey at the time and wondered whether it could be gamed.
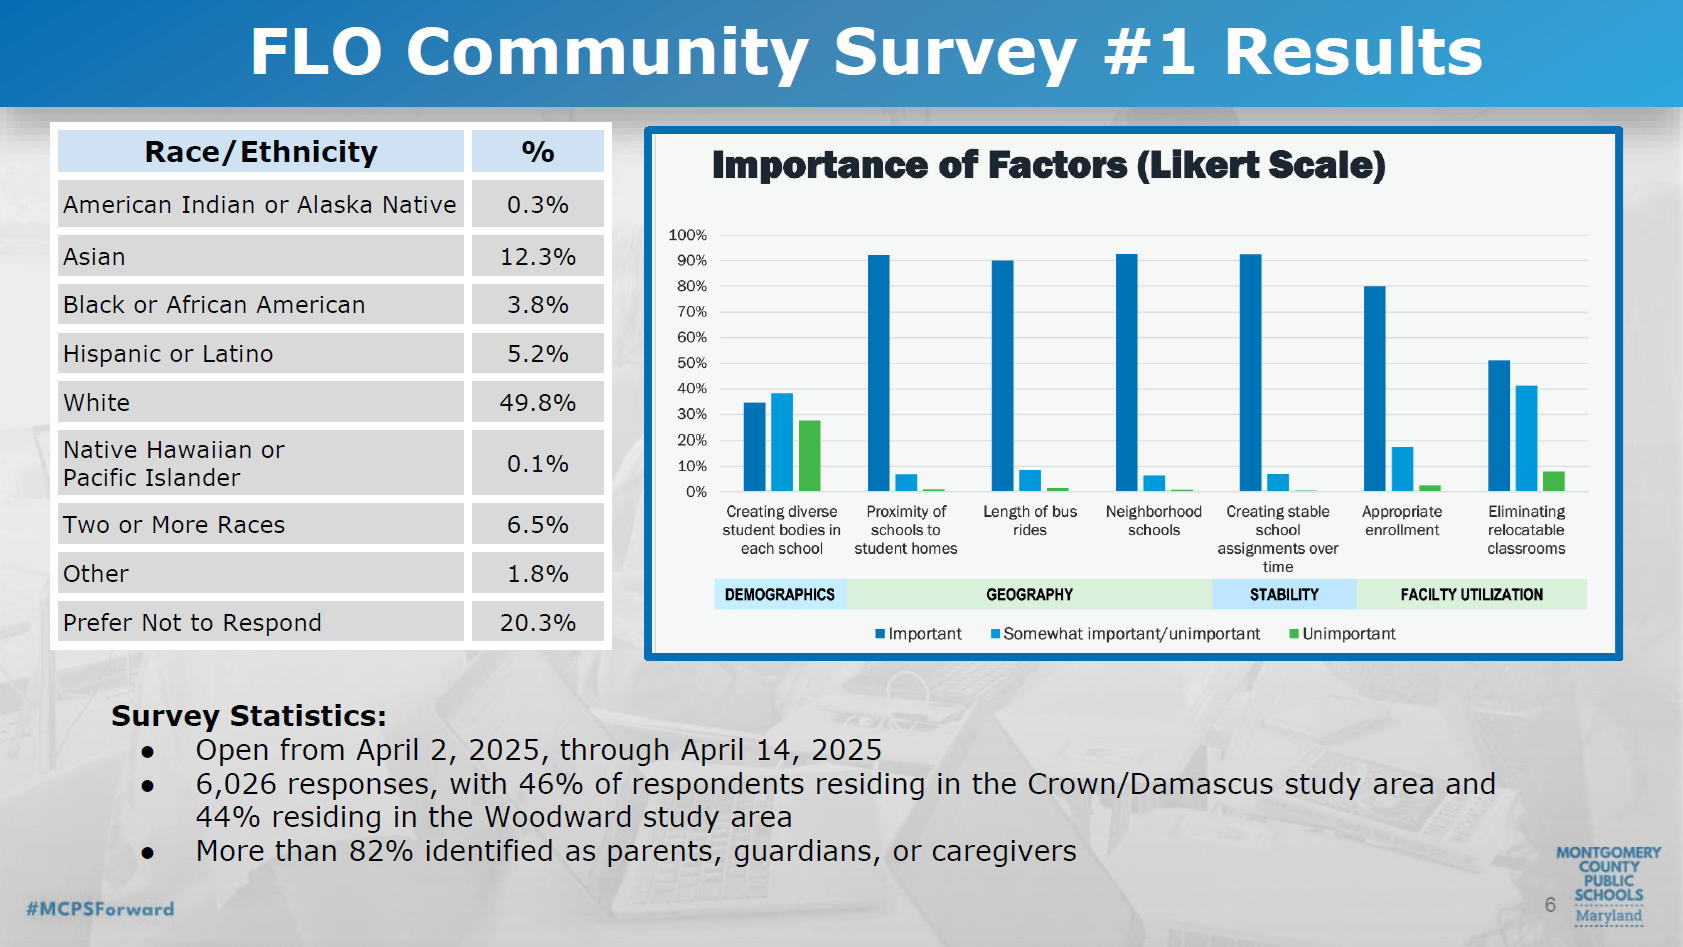
Take a look at the race/ethnicity breakdown. It looks heavy on White respondents and light on Black and Latino respondents, right? The table below shows how this respondent distribution compares to MCPS’s student body and the county’s population.
Given the over-representation of Whites and the huge under-representation of Blacks and Latinos, I question whether these results fairly represent the views of the community. Also of note is that this group rated diverse student bodies as a low priority compared to others in setting boundaries. Is that true? Or is it a reflection of a skewed sample?
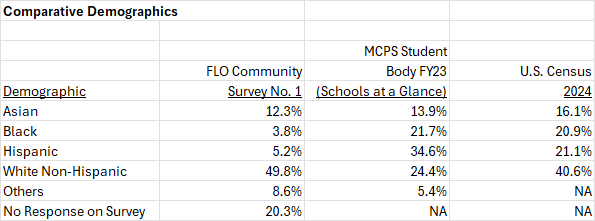
Now let’s go to page 7, which shows the response distribution from the Woodward boundary survey as of June 20. This survey is still open at this writing so the final distribution could change.
Folks in the Walter Johnson, Bethesda-Chevy Chase and Walt Whitman HS clusters account for 79% of responses. By contrast, folks in the five Downcounty Consortium high schools account for 17% of responses. That combined percentage is lower than the individual percentages of Walter Johnson (34% by itself), BCC (24%) and Whitman (21%).
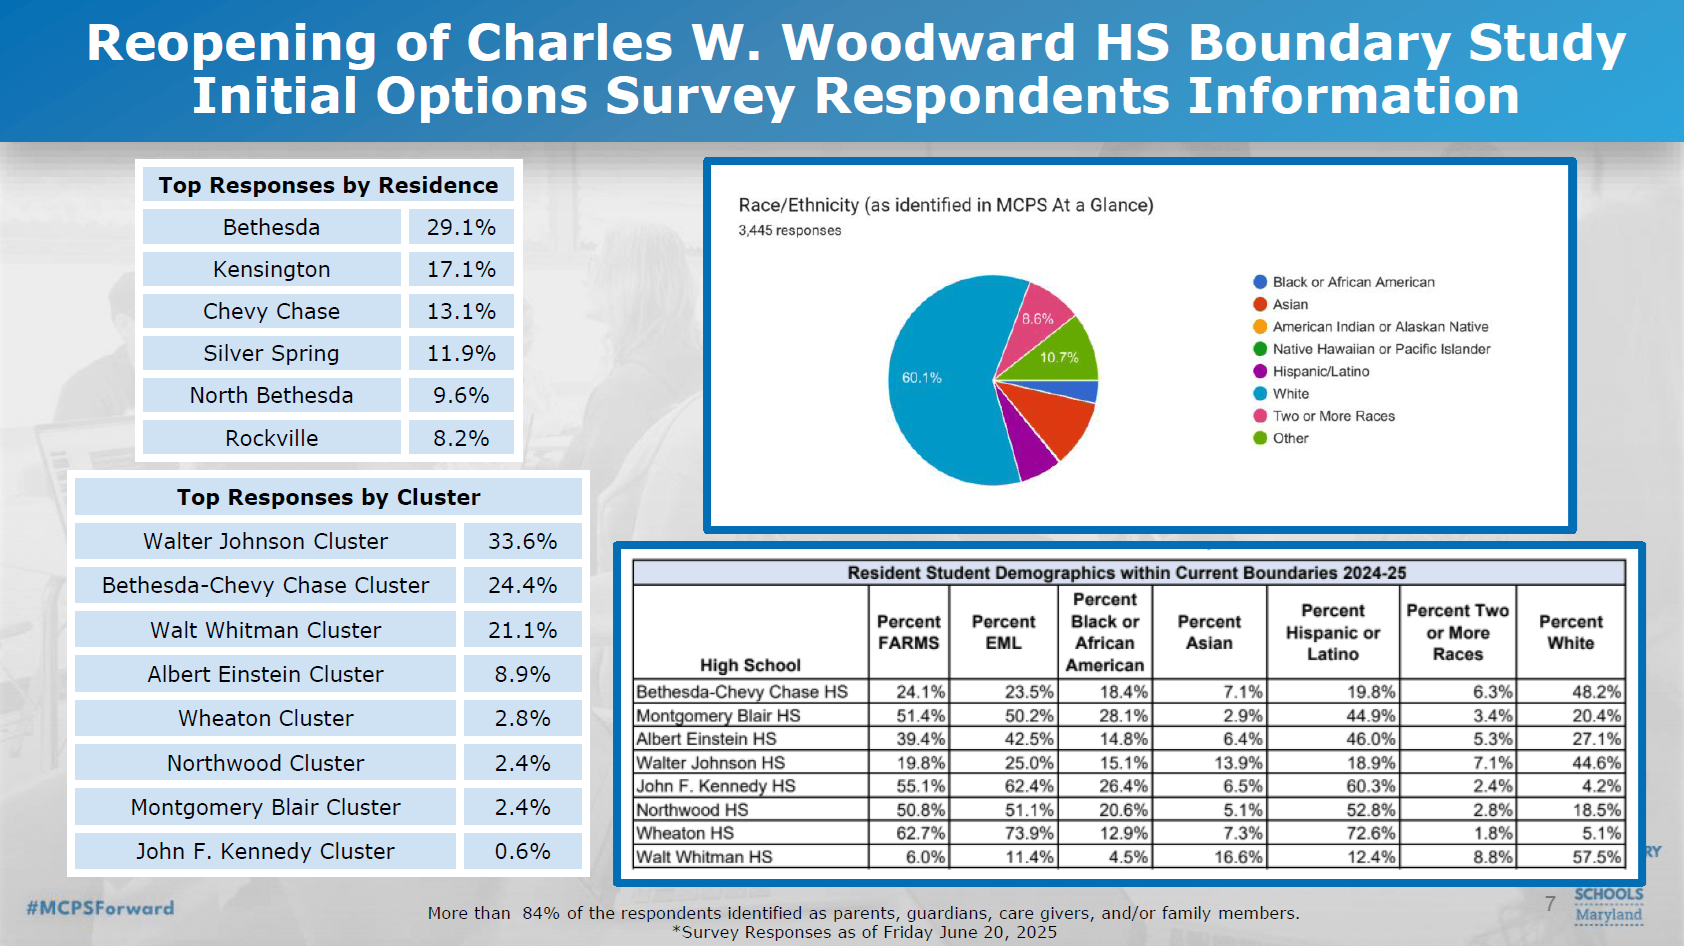
Page 8, shown below, shows the response distribution from the Crown boundary survey as of June 20. This survey is also still open.
Wootton HS all by itself accounts for 43% of responses and Winston Churchill accounts for another 17%. Meanwhile, schools in Germantown, Clarksburg and Damascus barely register.
Now let’s be fair to MCPS: it’s hard for all county agencies to gather input equitably across the county. This data reminds me of how Greater Greater Washington found that testimony on the attainable housing strategies initiative was dominated by residents of Chevy Chase. It also reminds me of longstanding Democratic voter turnout patterns, which favor White and affluent communities over others. Whether we like it or not, White people, wealthy people and seniors participate much more in county affairs than Black and Brown people, lower income people and young people.
But that reality doesn’t excuse the extreme skews in response rates seen here. These sample biases are so bad that they remind me of the old statistical term garbage in, garbage out. The staffers and/or contractors involved in promoting these surveys must do a better job of gathering a more representative sample even if perfect equity is fundamentally unattainable. Otherwise, MCPS is wasting money so long as it proceeds on this current path.
The full Secondary Program Analysis and Boundary Studies Community Engagement Plan Update can be viewed below.