By Adam Pagnucco.
One of my favorite offices in county government is the county council’s Office of Legislative Oversight (OLO). Staffed by ace analysts, it is the county’s think tank and is roughly analogous to Congress’s U.S. General Accounting Office. OLO’s reports are fabulous deep dives into all kinds of issues facing the county. You can learn a lot about MoCo by reading them.
OLO’s newest report, written by veteran analyst Aron Trombka, is titled Montgomery County Then and Now: A Survey of Demographic, Economic, Social, and Community Data Trends Over the Past Two Decades. Trombka is simultaneously thorough and simple, presenting dozens of charts on how the county has changed since 2000 – and how it has not. The whole report is worth reading but here are ten charts that jumped out at me.
MoCo is now a firmly majority-minority jurisdiction.
Back in 2000, non-Hispanic Whites were a majority of the county’s population. In 2023, they were just 39% of residents. Every other group has increased its percentage, especially Hispanics.

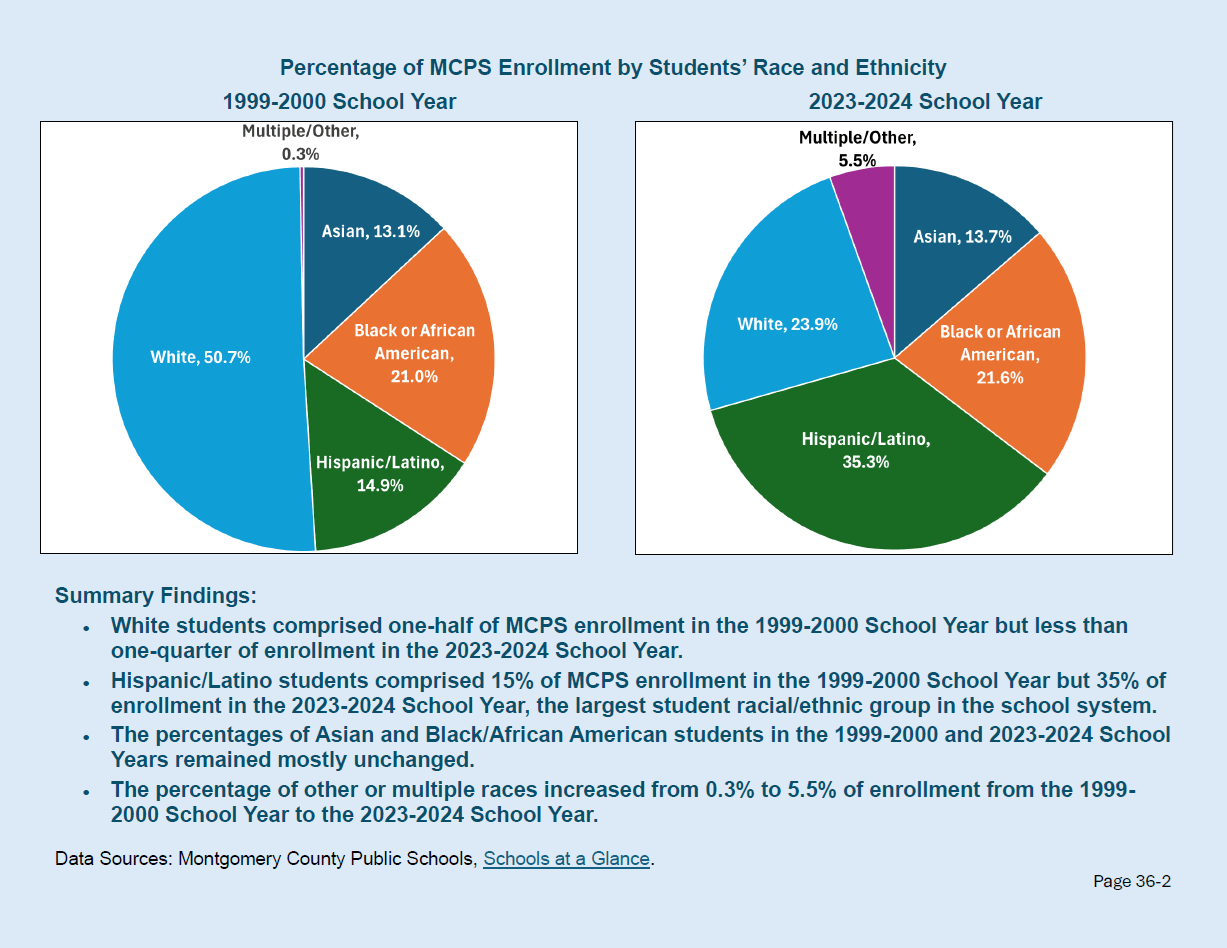
MCPS has seen a ton of demographic change.
In 2000, White students were half of MCPS’s student body. Now they account for less than a quarter. Hispanic/Latinos are a plurality while the shares of Black and Asian students have hardly budged.
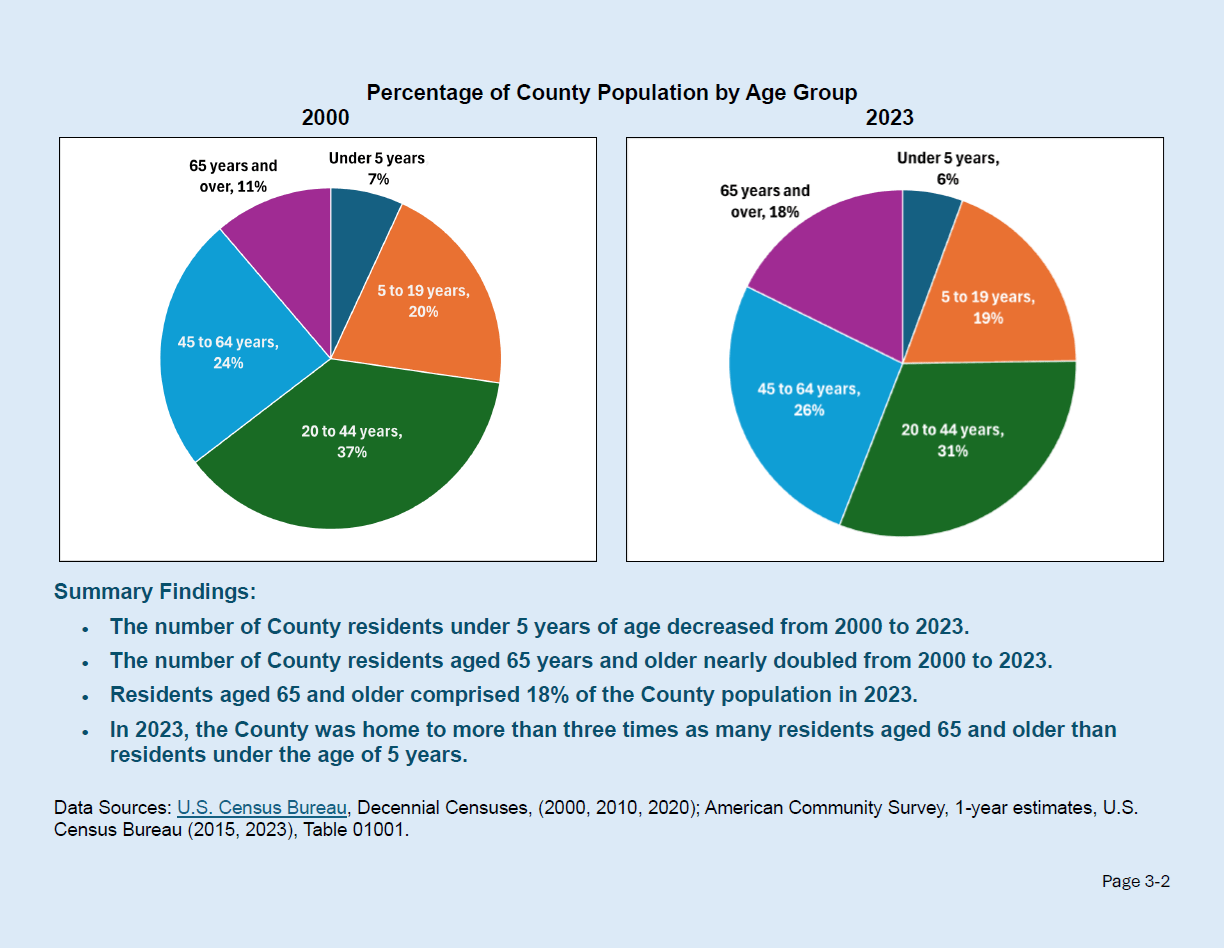
The county is getting older.
In 2000, residents age 45 or older comprised 35% of the population. In 2023, they were 44% of the population. This has obvious implications for demands on county services and the local healthcare system.
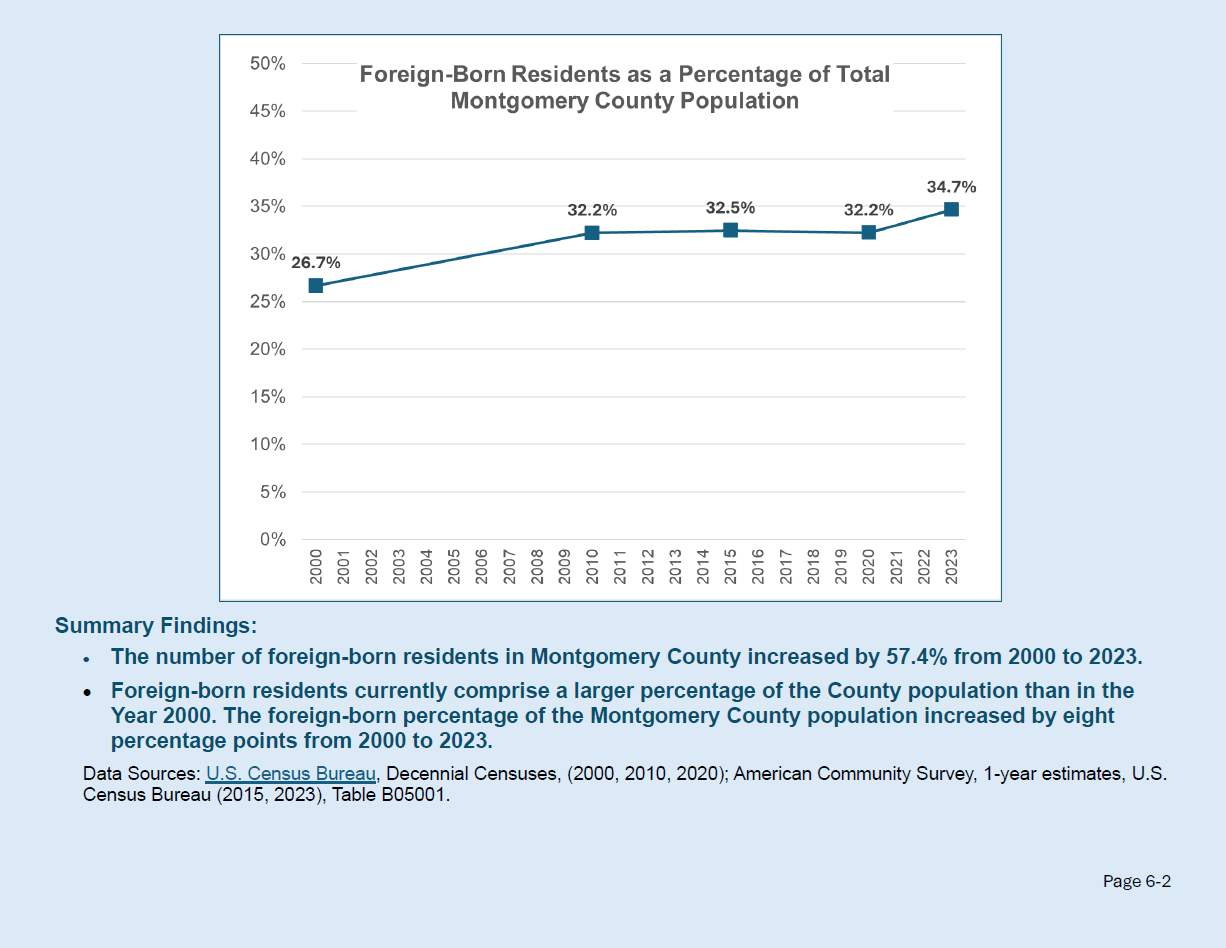
The foreign-born share of the population is increasing.
In 2020, foreign-born people accounted for slightly more than a quarter of the county’s population. In 2023, they were more than a third.
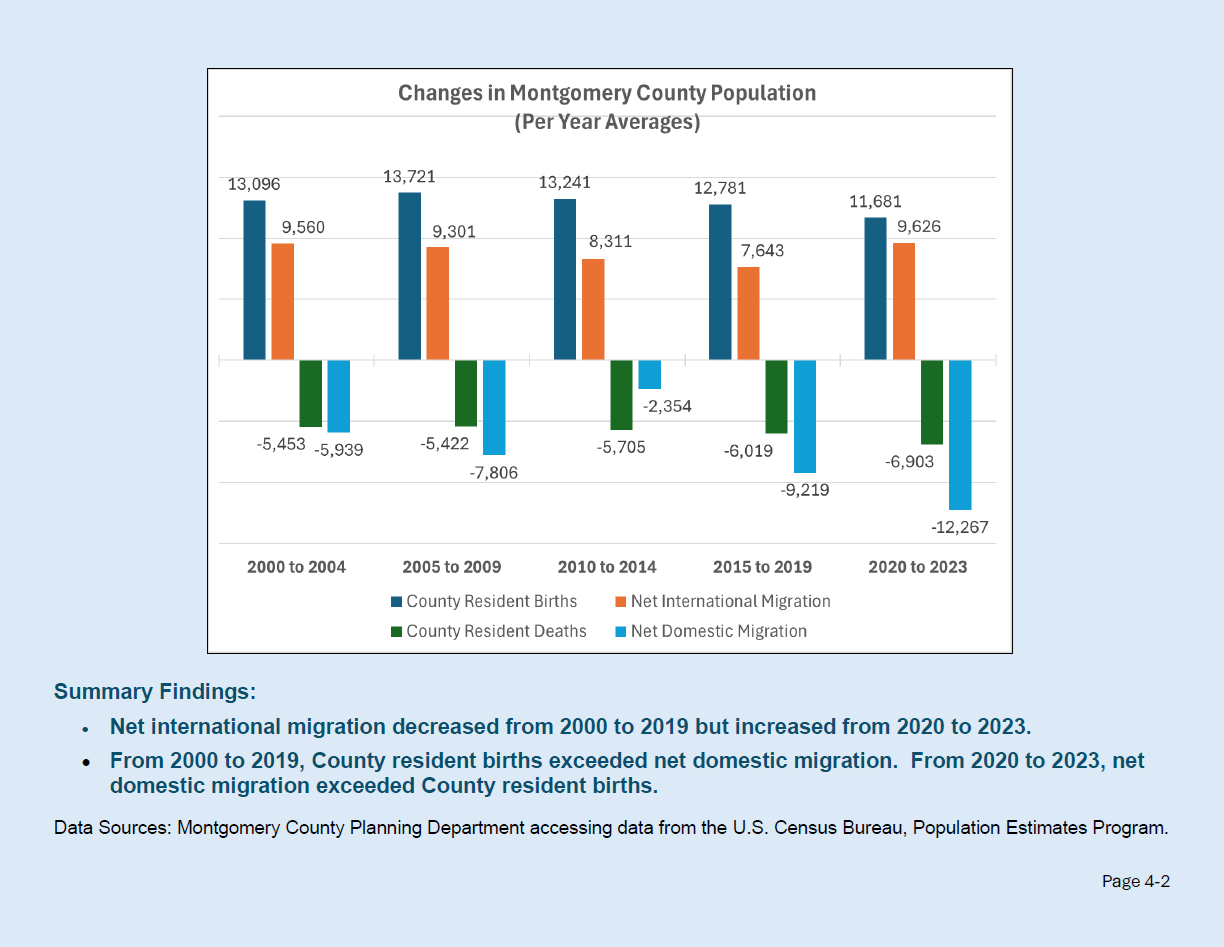
Net domestic outmigration is increasing.
The county’s population growth, while slowing, is still slightly positive because of births exceeding deaths and net positive international migration. However, net domestic outmigration is picking up and that is impacting population growth. I have found the same thing in studying IRS taxpayer data, and here’s the kicker: the people moving out make more money than the ones who are moving in.
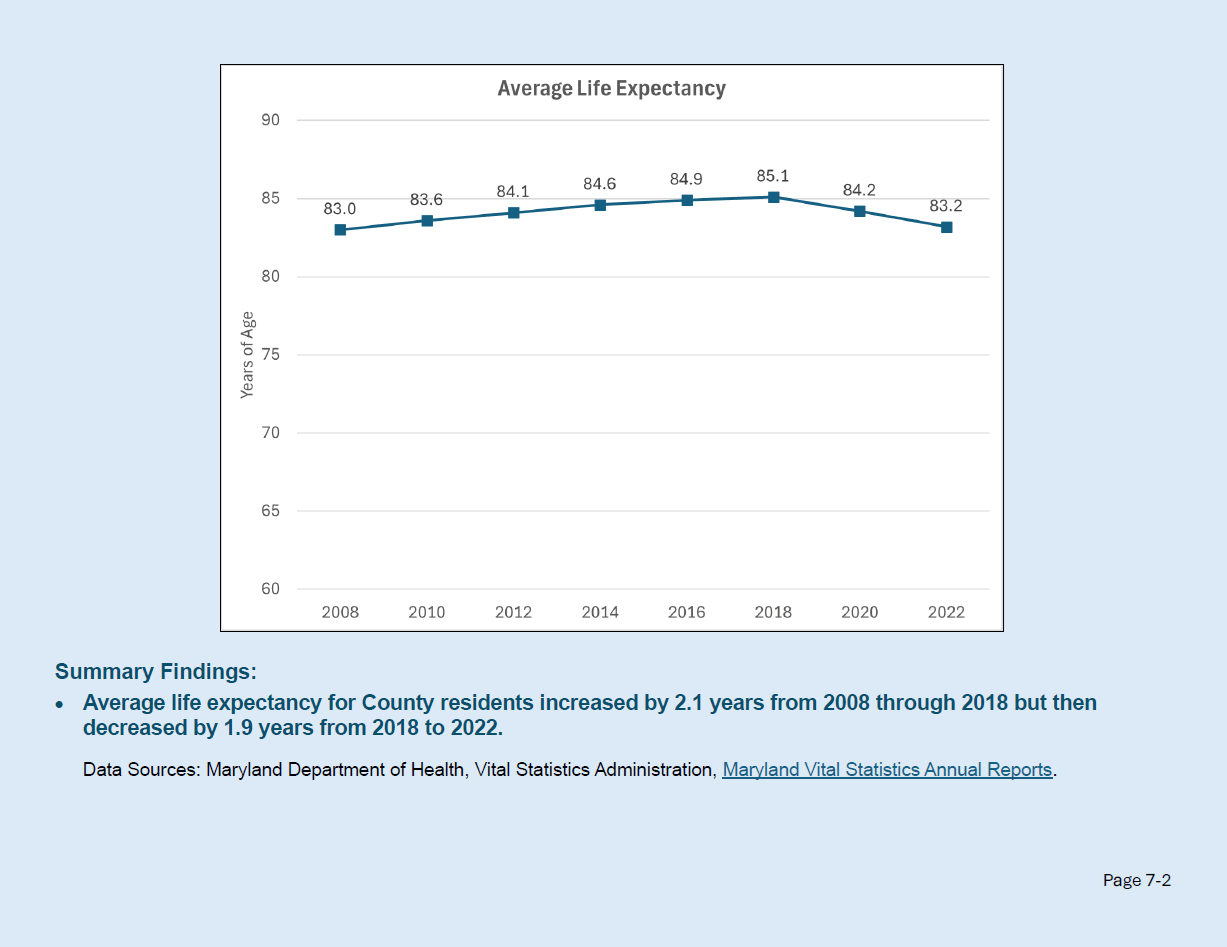
Life expectancy has been recently declining.
The county’s average life expectancy increased from 2008 through 2018 but has been falling since. One obvious question: since the last two data points were in 2020 and 2022, how much of that decline can be explained by COVID? I suspect a little, but MoCo did a good job of limiting COVID cases and encouraging vaccinations. In any event, this is not a great stat for any jurisdiction.
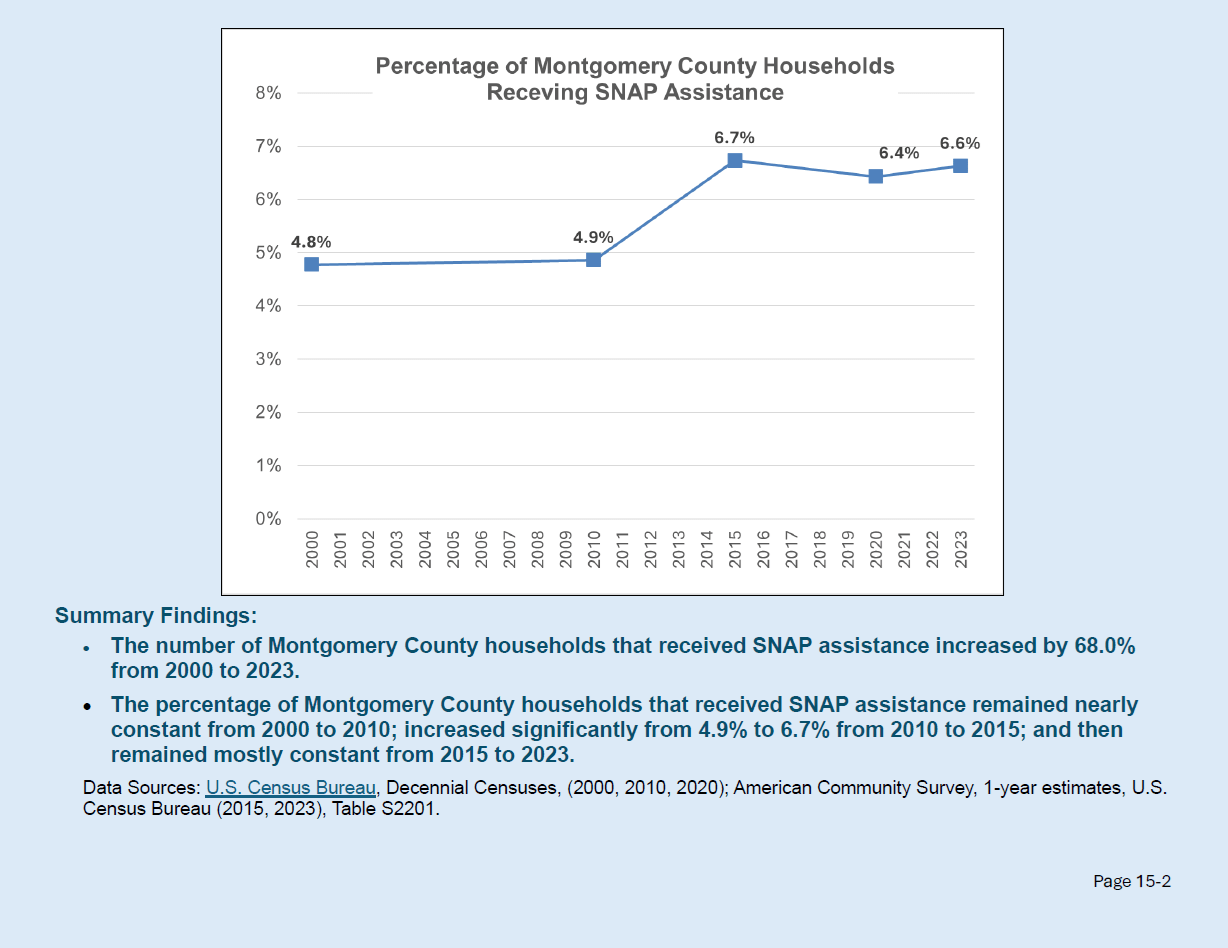
The percentage of residents receiving SNAP benefits has risen.
In 2000 and 2010, less than five percent of residents were receiving Supplemental Nutrition Assistance Program (SNAP) benefits. Since then, the percentage has hovered between 6.4-6.7%. This is a sign of increased need in part of our community and a predictor of demand for associated services.
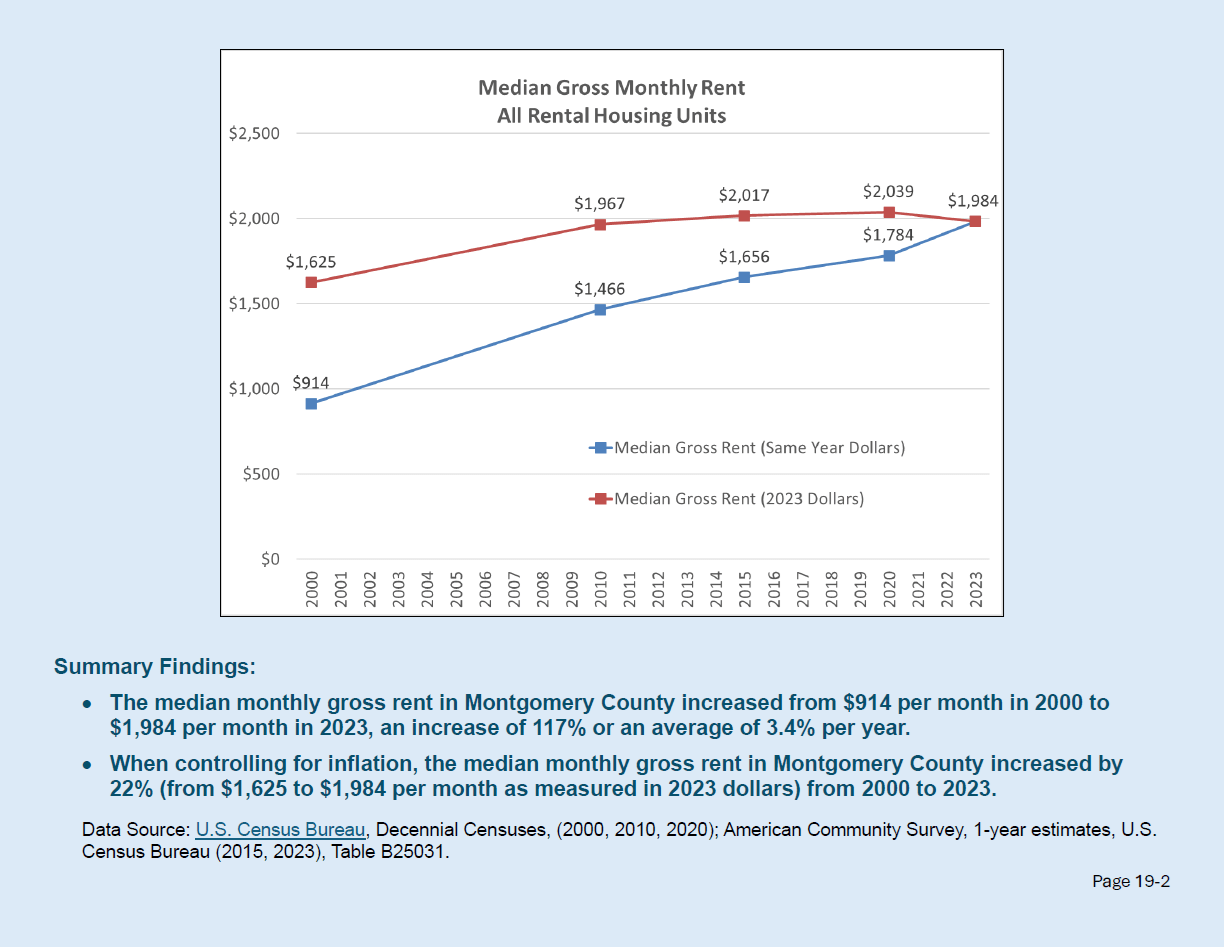
Adjusted for inflation, median monthly rent has been flat since 2010.
Advocates for rent control (some of whom were subsidized by noncompetitive county grants) claimed there were widespread rent increases of 20 percent or more when the council passed its law two years ago. The truth is that median rent, when adjusted for inflation, hardly budged between 2010 and 2023. As a result of rent control, the county has wiped out multifamily housing construction when there was no justification for doing so.
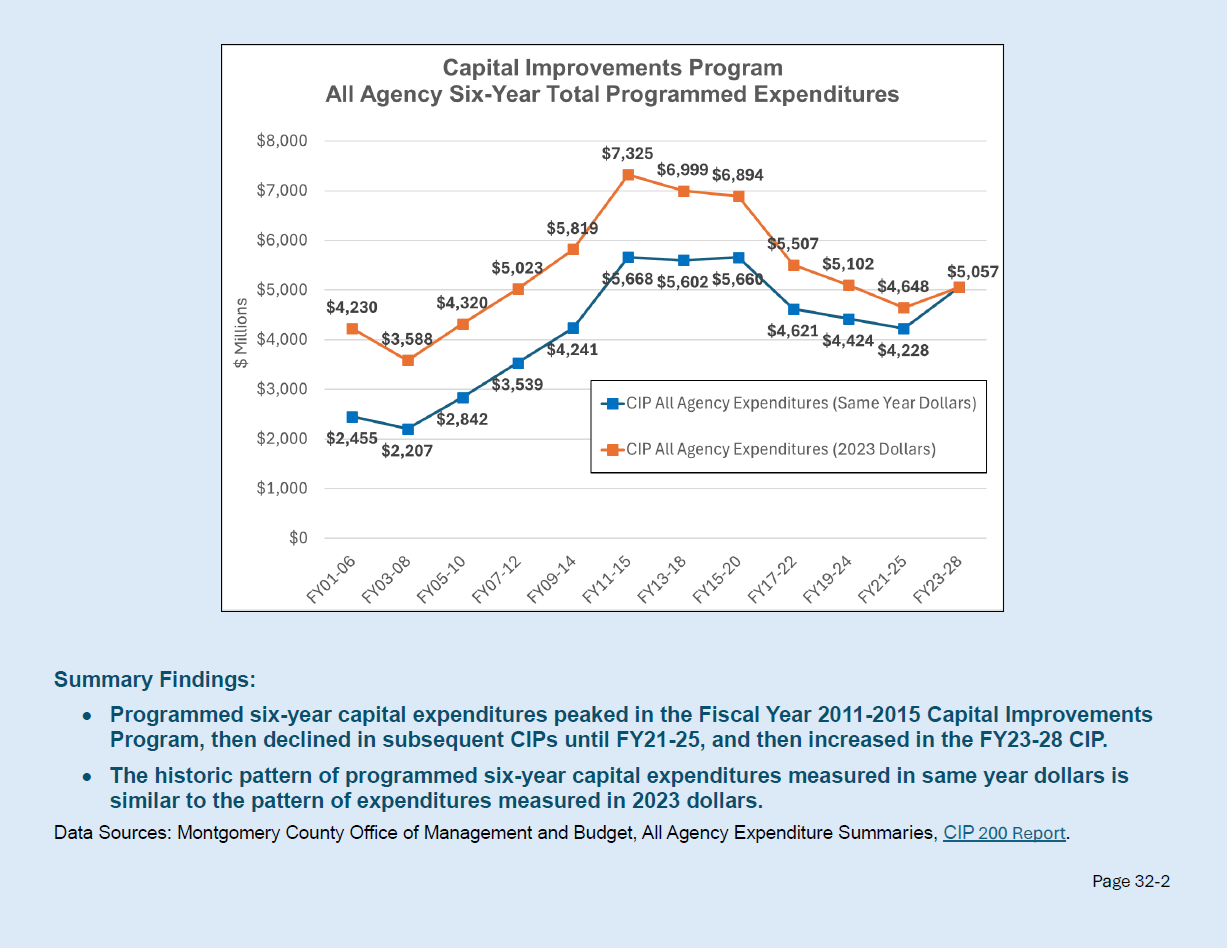
The county has sharply cut back on capital spending over the last twelve years.
In both real dollars and nominal dollars, the county’s six-year capital budget has been sharply reduced since the FY11-15 budget. That’s partly because debt service, which is used to pay off bonds, grew to unsustainable levels in the years following. But operating spending has continued to increase, demonstrating that advocacy for operating budgets (and especially their collective bargaining agreements) is louder than advocacy for capital projects. School construction has held up well but transportation infrastructure faces increasing pressure, especially on maintenance.
Adjusted for inflation, median household income is flat.
Real dollar median household income has hardly changed in more than twenty years. Think of the enormous cost pressures building on our population (and we’re not alone): home prices, electricity, childcare, health insurance, college education and the more recent COVID supply chain issues as well as President Donald Trump’s tariffs. This is why cost of living emerged as the number one concern in the Banner’s recent poll of county residents. Elected officials should think long and hard about adding to this pain with more tax hikes, as the county and state have already done over the last two years.
