
By Adam Pagnucco.
Part One explained the methodology of this series, which looks at U.S. Census data on residential addresses to approximate housing units. Today we will begin looking at the data.
Let’s start with a simple cut: the District of Columbia, Maryland and Virginia over the six time snapshots in the series: April 2020, July 2023, November 2023, July 2024, November 2024 and July 2025. (November 2025 data was released after I completed my tabulations.)
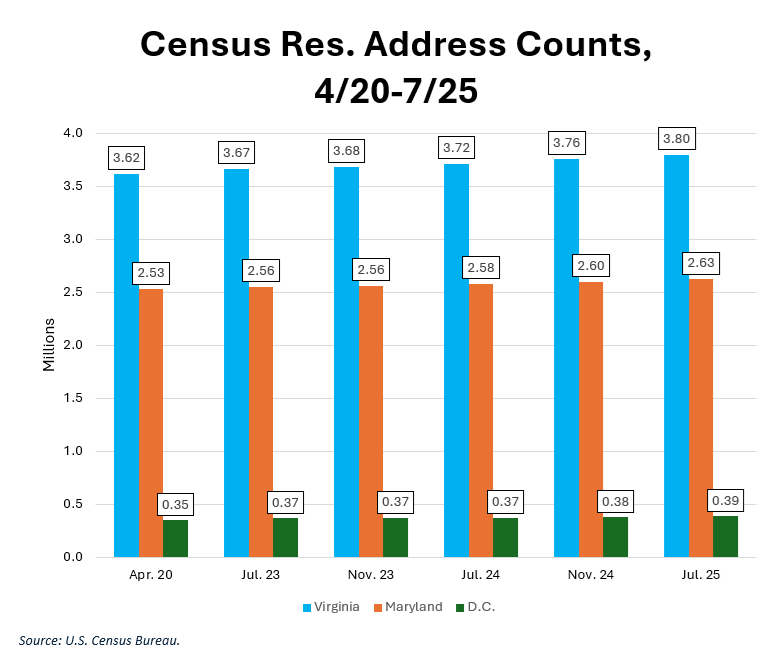
This is my first time using this data but here’s one thing I noticed right away: address counts in April 2020 exactly match the number of housing units reported in the decennial census. That makes sense since address locations in the Census file are used to deploy field workers. Thereafter, the counts are close to but not identical to the one-year counts of units in the American Community Survey.
Now let’s look at growth rates in the three jurisdictions.
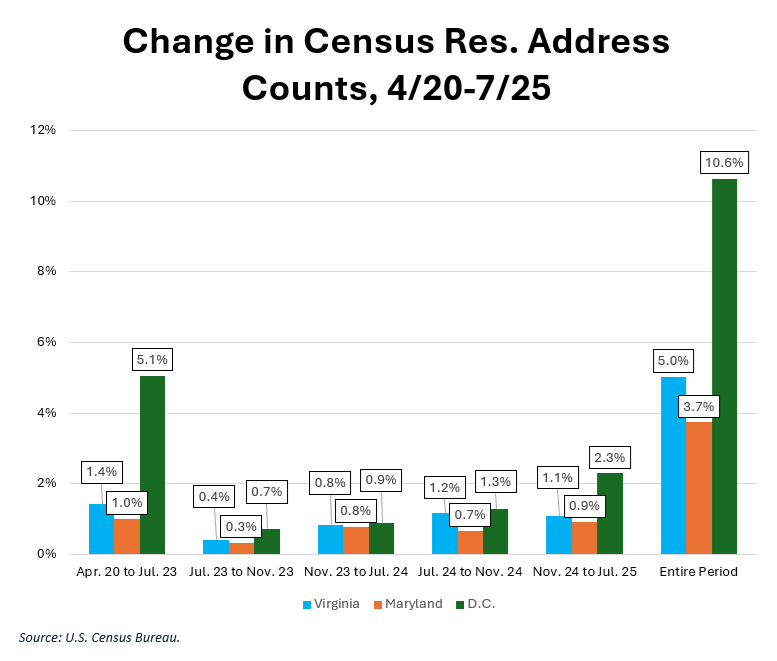
Over this period, D.C. led in address count growth with a robust 10.6% growth rate over slightly more than five years. Virginia was next with 5.0% and Maryland trailed with 3.7%. This is broadly consistent with the theme of more economic growth in Virginia than Maryland. But let’s keep in mind that there are big differences inside each of those states as we will see later in this series.
As for D.C., it has two advantages. First, it is the only capital of the United States in the Milky Way galaxy, so there will always be some residents and employers who will put up with almost anything to be there. (Sadly, the same can’t be said for the many competing suburban jurisdictions.) Second, relative to Maryland and Virginia, D.C. is small and percentage rates can be high when applied to a small base. As we shall see soon, there are a handful of even smaller localities in the region that have equaled or even surpassed D.C.’s address count growth rate.
But wait a minute, D.C. has a rent control law. Shouldn’t that be suppressing housing growth? Perhaps, but there are a few provisions in D.C.’s law that ease its impact on housing production. We shall get into the details later.
Next: We will look at address count growth inside Maryland and the Washington region.