By Adam Pagnucco.
Last time, we looked at MoCo’s gross domestic product (GDP). Now let’s look at GDP per capita.
The U.S. Bureau of Economic Analysis defines GDP as “The market value of goods and services produced by labor and property in the United States, regardless of nationality.” That’s effectively the size of our economy. GDP per capita measures the size of our economy per person, and in effect, our per capita tax base. GDP can increase, but if population increases faster, GDP per capita will fall.
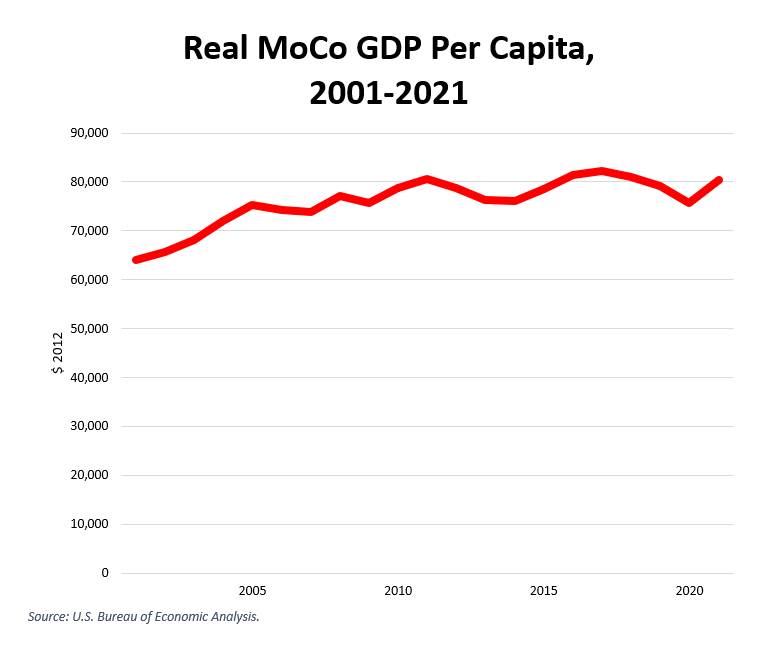
The chart below shows our county’s GDP per capita in real (2012) dollars from 2001 through 2021. Note how cyclical it is. Also note how GDP per capita in 2021 ($80,432 in 2012 dollars) was less than in 2017 ($82,322) and 2011 ($80,610). We can blame the pandemic for part of this weak performance, but clearly, there are longer term issues as well.
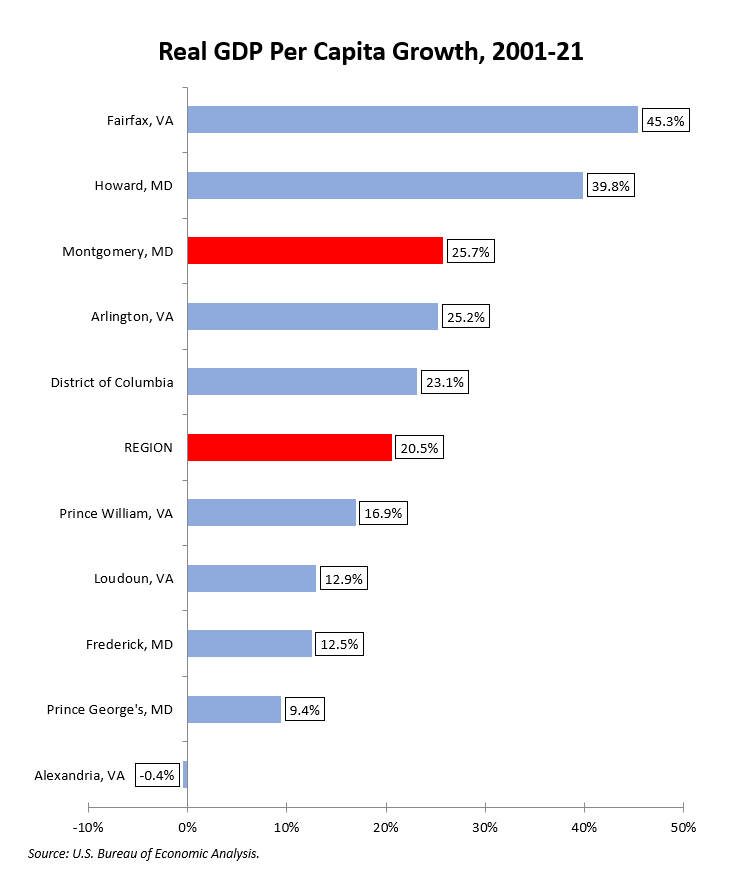
The chart below compares growth in GDP per capita between the region’s largest jurisdictions over the last 20 years. We did well on this measure and beat the regional average. Only Fairfax and Howard did better.
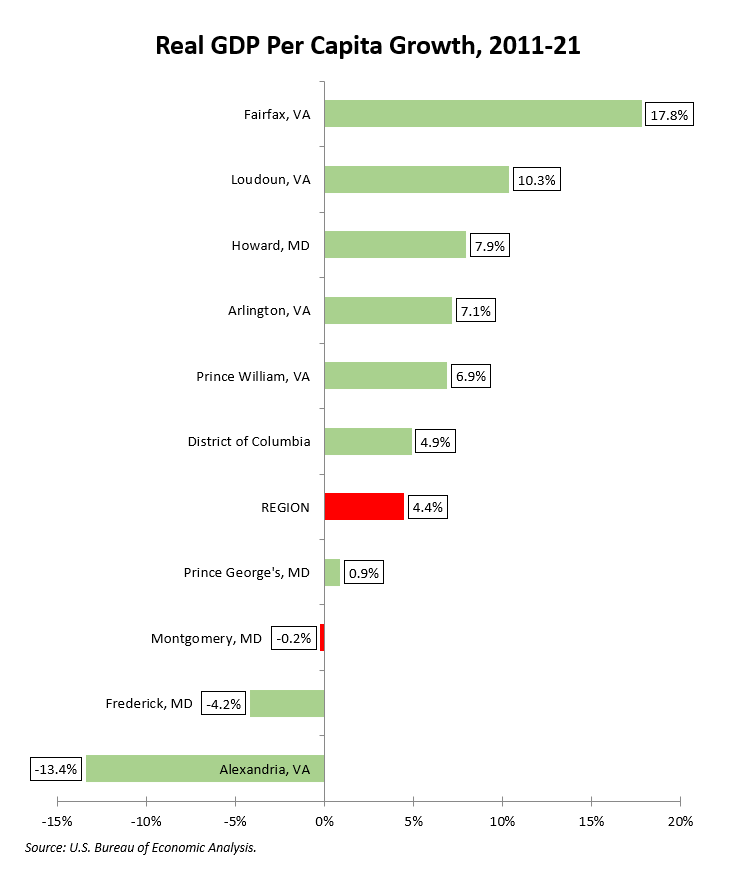
The story changes when we look at the last decade. Our growth in GDP per capita stalled while most of the region forged ahead. (At least we aren’t Alexandria, which saw simultaneous GDP decline and population growth.)
Finally, the chart below shows 2017-21, a period in which our GDP dropped by 2.3%. That matched our drop in GDP per capita because our population saw almost no growth. Only Frederick fared worse, which makes me wonder how much all of their new jobs are paying.

Along with the stalling of GDP, this halt in growth of GDP per capita should be a warning sign for our policy makers. Our economy is not creating more wealth per person. Bear that in mind as we consider tax increases.
We will look at personal income next.