By Adam Pagnucco.
Last time, we looked at wage and salary employment growth and found that we lagged most of the region over the last decade and the last twenty years. Now let’s look at average wages.
The chart below shows wages and salaries per wage and salary job in 2021 from the U.S. Bureau of Economic Analysis.
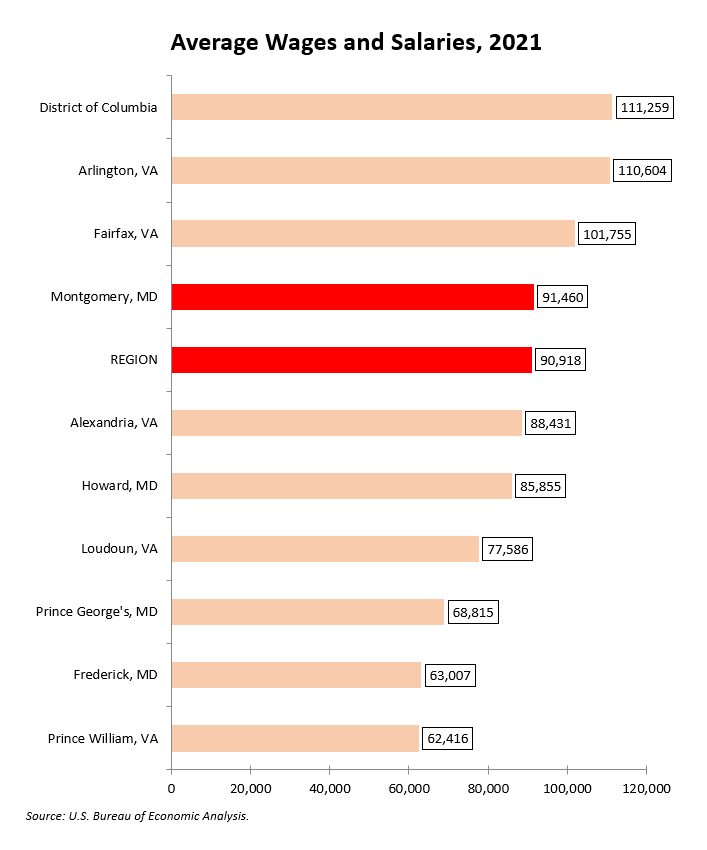
Unlike most measures we have looked at, MoCo doesn’t look bad on this measure. We are slightly above the regional average and we lead many competitors.
Now let’s look at change in real annual wages and salaries over the last twenty years. This data is adjusted for inflation using the Washington-Arlington-Alexandria CPI-W.
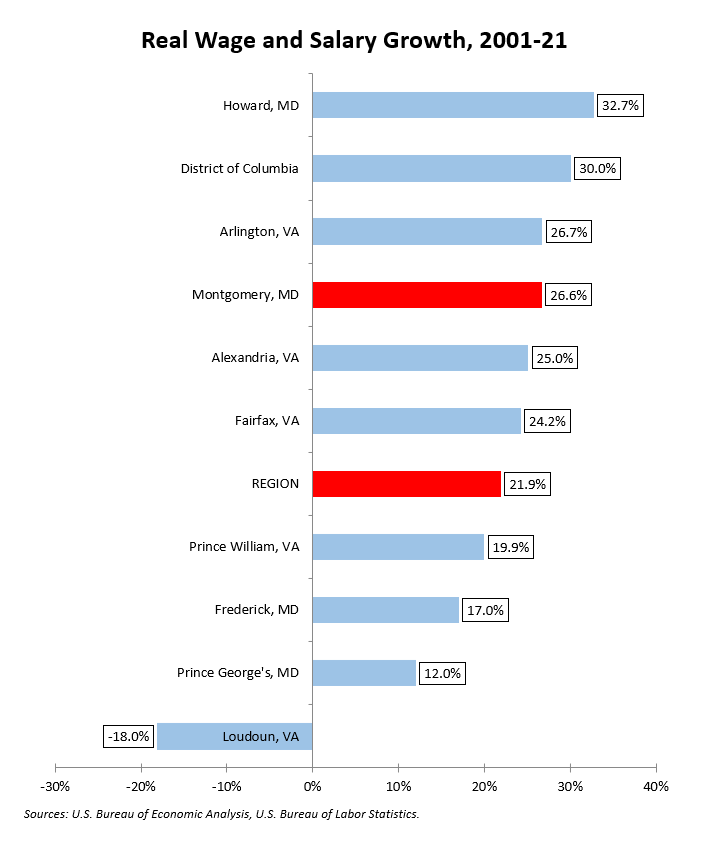
This is not a bad news chart. We exceeded the regional average and most of our competitors in real wage growth over this period.
The chart below shows the same information over the last decade.
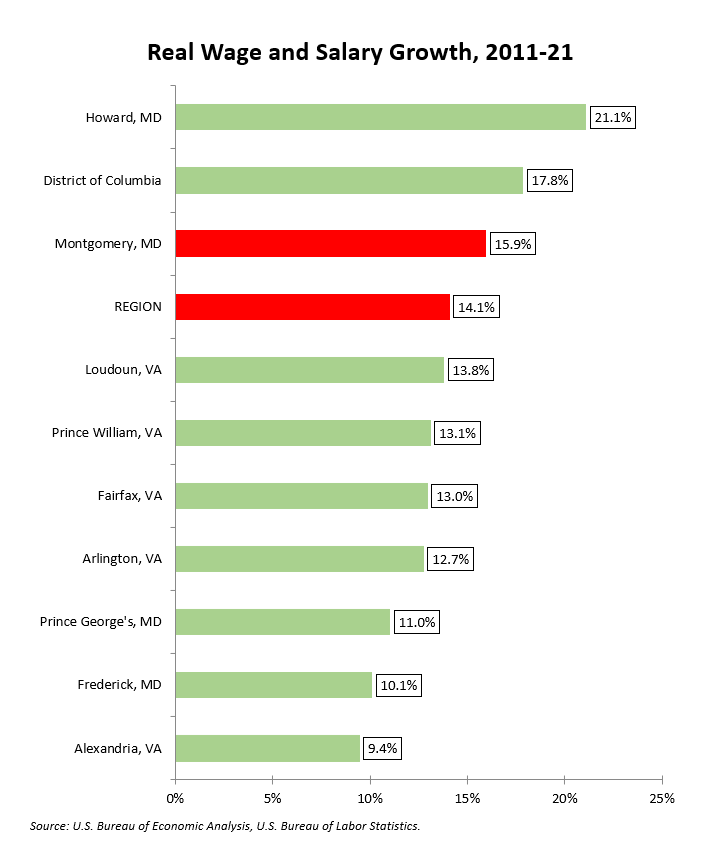
Once again, we beat the regional average and most of our competitors.
So the story with real wages is not that our competitors are leading us, which is true of most economic stats in this series. Instead, what’s going on is that neither we nor the region as a whole are seeing much real wage growth. The chart below shows average annual growth in real wages by decade for both us (in purple) and the region (in yellow).
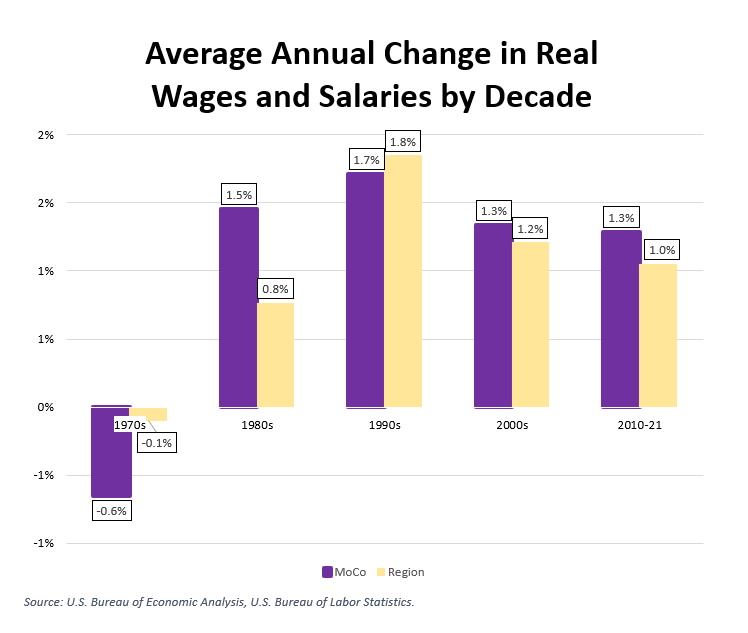
The 1990s was the best decade for real wage growth. Since then, both we and the region have been averaging slightly more than 1 percent growth per year. That’s not a lot of money to earn a higher standard of living, and let’s bear in mind that that is an average. Lots of folks are doing worse.
Next: A look at proprietor income.