By Adam Pagnucco.
In Part Two, we looked at changes in total operating budgets and enrollments for Maryland’s top eight school districts: Baltimore City and Anne Arundel, Baltimore, Frederick, Harford, Howard, Montgomery and Prince George’s counties. Today we look at total operating funding per pupil.
The chart below shows the total operating budget divided by enrollment for each of the above school districts in FY24.
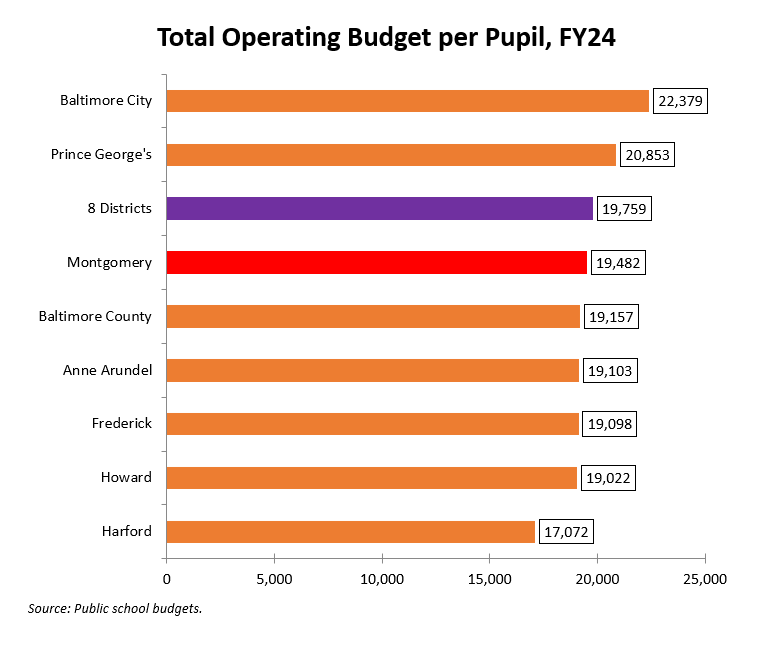
Montgomery County ranks behind Baltimore City and Prince George’s but is in the same ballpark as most of its peers. The reason why Baltimore City and Prince George’s do well on this measure is because they receive proportionately more state aid than the other districts shown here. We will discuss local funding per pupil soon.
Now let’s look at the change in total operating budget per pupil from FY23 through FY24.

Anchored by its 4.7% property tax hike, MoCo did well on this measure, trailing just Frederick County and Baltimore City. But the story changes as shown in the chart below, which shows the change in this measure from FY17 through FY24.
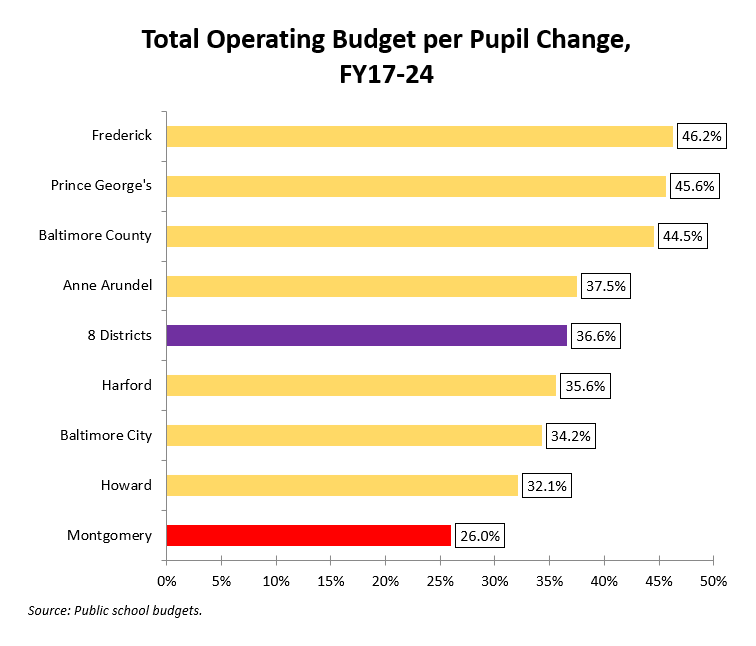
Here, MoCo is at the bottom. We have discussed the reason for that before: MCPS did well in FY23 and FY24 but was in a dry spell for five years prior. It’s not a coincidence that FY17, the base year for this period, was the last time that the county raised property taxes and cited school needs as a reason.
The above stats apply to total operating budgets so there is a strong caveat here: county governments do not control all the resources that schools get. State aid is a huge funding source for school districts and is driven by formulas set in state law. In some districts, it actually exceeds county appropriations for schools. We will discuss county appropriations – the money that the counties actually control – next.