By Adam Pagnucco.
What caused WAMU to implement layoffs and shut down DCist? Insights into these actions may lie in its published financial statements. Let’s get started.
The chart below shows WAMU’s operating revenues and operating expenses from FY05 through FY23.
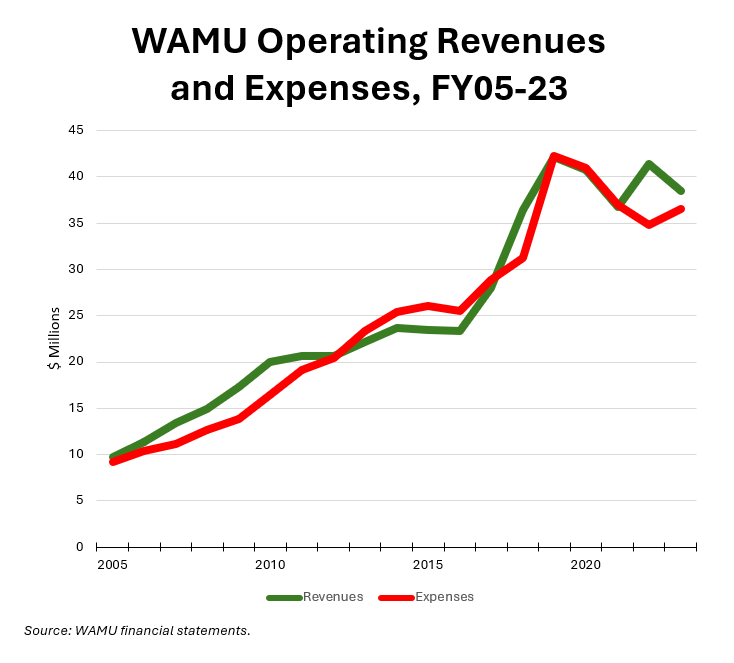
In most years, operating revenues exceeded expenses. The exceptions were in FY13-17 and FY19-21, with the latter two years containing the pandemic. From FY19 (the year before the pandemic) through FY23, revenue dropped by 9% while expenses dropped by 14%. This indicates an aggressive and effective effort by the station to control costs in response to falling receipts.
Let’s look at revenues more closely. The chart below shows WAMU’s three largest revenue sources – contributions, corporate underwriting and donations of goods and services from American University (AU) – since FY05.
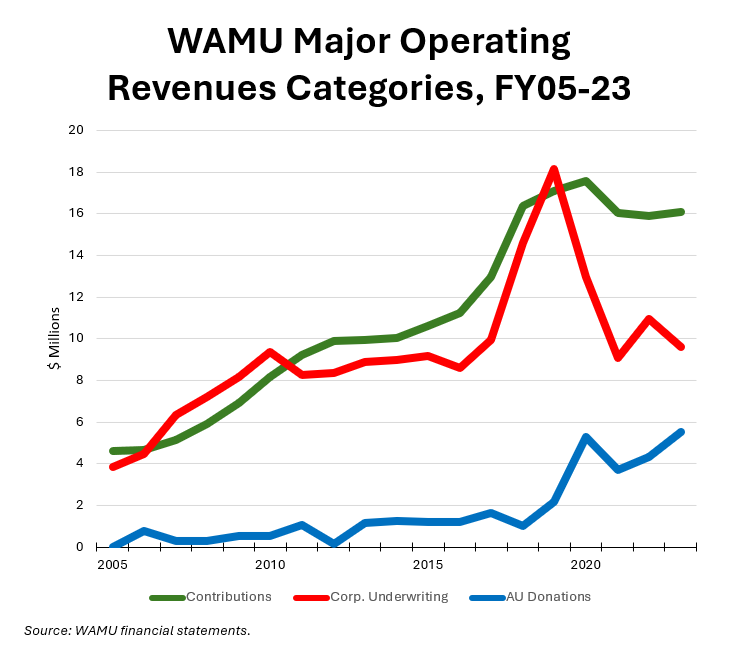
Contributions, which come from individuals and organizations, are WAMU’s largest revenue source. They peaked at $17.6 million in FY20, the first year of the pandemic, and have dropped to $16.1 million in FY23.
Corporate underwriting is the second-largest revenue source. It peaked at $18.1 million in 2019, the year before the pandemic, and plummeted to $9.6 million in FY23. This is a huge challenge for WAMU and is a much larger change than what occurred during the Great Recession.
Donations of goods and services from AU are WAMU’s third largest revenue source. Here is how they are described in the most recent financial report:
The Station reimburses the University for a portion of indirect support that includes facilities and administrative support, based on a predetermined formula, and is allocated among program and supporting services expense in the accompanying statements of activities. Facilities support from the University includes occupancy costs at estimated fair value based on market rental rates for similar occupancy space usage. Administrative support from the University includes allocated services and certain other expenses incurred by the University on behalf of the Station…
As described above, the University provides the Station with facilities and administrative support which is allocated to the Station based on a predetermined formula. The indirect support rate applicable to the Station for the years ended June 30, 2023 and 2022 was 38.0% and 34.0%, respectively, and was applied to the Station’s allocable operating costs. The total indirect support expenses are allocated among program and supporting services expense in the accompanying statements of activities.
As corporate underwriting has declined, support from AU has increased. For many years, AU’s support varied from hundreds of thousands of dollars to $1.6 million in FY17. In FY19, this support hit $2.2 million and in FY23, it totaled $5.5 million, the highest amount shown in at least 19 years.
Consider how the percentages of WAMU’s revenue sources have changed in a short period. In FY19, 41% of revenues came from contributions, 43% came from corporate underwriting and 5% came from AU donations. In FY23, 42% came from contributions, 25% came from corporate underwriting and 14% came from AU donations.
WAMU’s dependence on AU is growing quickly. And it’s time to remember this statement from the financial reports: “WAMU is dependent for its continued operations on the financial support of the University.”
We will have more in Part Three.