By Adam Pagnucco.
Part One looked at voting mode by party in MoCo’s 2024 primary. Part Two looked at turnout rates by party and region. Today we will study turnout rates by district and local area.
First, while Part Two found substantial regional differences in turnout by Democrats, it did not find them among Republicans and unaffiliated voters. Therefore, this post concentrates on Democrats. The chart below shows Democratic turnout by local area in the 2024 primary. For definitions, see my elections methodology post.
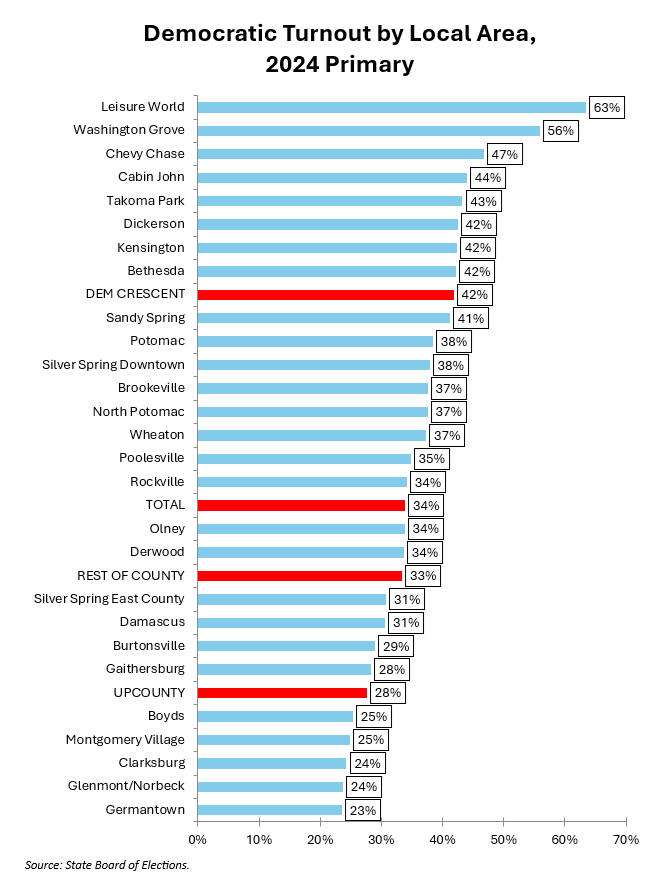
With a few tweaks here and there, the ordering of local areas in the above chart could apply to almost any election in MoCo that I have studied. Leisure World ranks first because seniors vote at much higher rates than any other age group. (Politicians who don’t know that really should not bother to run for office!) Most of the other leading communities trend wealthy and/or progressive. At the bottom are communities that tend to be less affluent, further to the north and/or west and are heavily Black and/or Brown. This is what MoCo elections look like, folks.
The chart below shows Democratic turnout by congressional, state and council district in the 2024 primary.
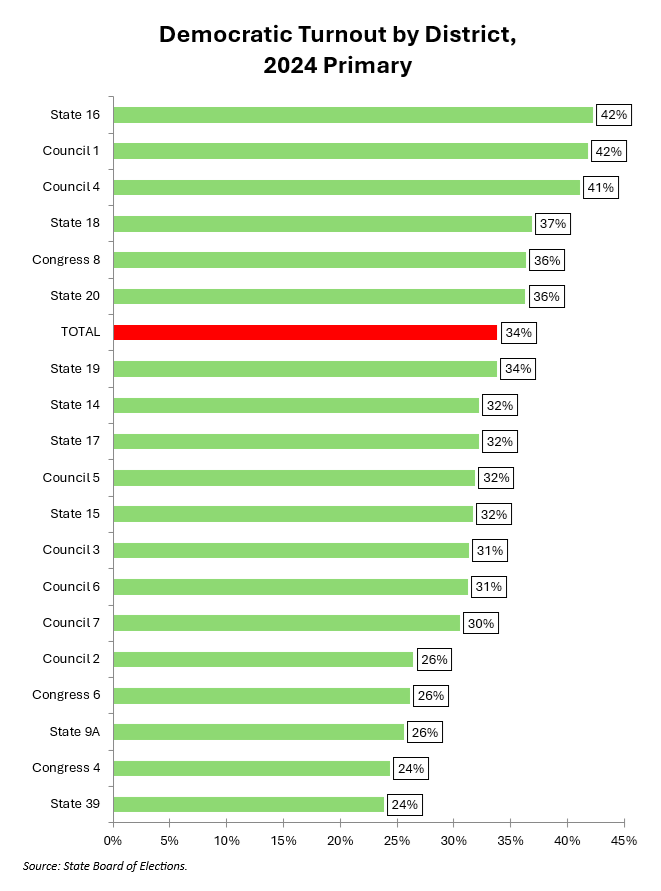
Again, this is exactly what I expect to find in any MoCo election. The highest turnout districts are concentrated around Bethesda, Chevy Chase and Kensington (State 16 and 18, Council 1) and Silver Spring and Takoma Park (State 20 and Council 4). Council District 4, known as the Bowtie District, combines Silver Spring, Takoma Park, Kensington and North Bethesda, a unique structure conferring a lot of potential political power on its occupant. (I’m talking about you, Council Member Kate Stewart). Lagging districts tend to lie in the north.
Four years ago, future Council Member Marilyn Balcombe, who was at the time a former council candidate and leader of the Gaithersburg-Germantown Chamber of Commerce, wrote a guest post for us titled The Upcounty Doesn’t Vote and Nobody Seems to Care. In it, she used data from the 2018 Democratic primary to document Upcounty’s lagging turnout. In truth, she could have used data from any election in the last twenty years and her point still would have had merit. It’s 2024 and Upcounty still doesn’t vote (at least not as much as the rest of the county). Does anyone care?
Next, we look at an even more consequential stat package: voting patterns by race. Don’t miss it!