By Adam Pagnucco.
Part One looked at voting mode by party in MoCo’s 2024 primary. Part Two looked at turnout rates by party and region. Part Three studied Democratic turnout rates by district and local area. Today we will look at Dem turnout and race.
My elections methodology post explains how I measure racial demographics. First, I matched precincts with U.S. Census data to derive percentages of racial groups in population. I know this is not an exact match for racial demographics of actual voters but it’s as close as I can get aside from using flawed estimates in databases like MDVAN. Second, I calculate results for the 25 precincts with the highest percentages of each major racial group (Asian, Black, Latino and White). I find it noteworthy when these methods produce similar trends in voting.
Let’s start with Asians. The chart below shows Democratic turnout in precincts with differing concentrations of Asians in their population.
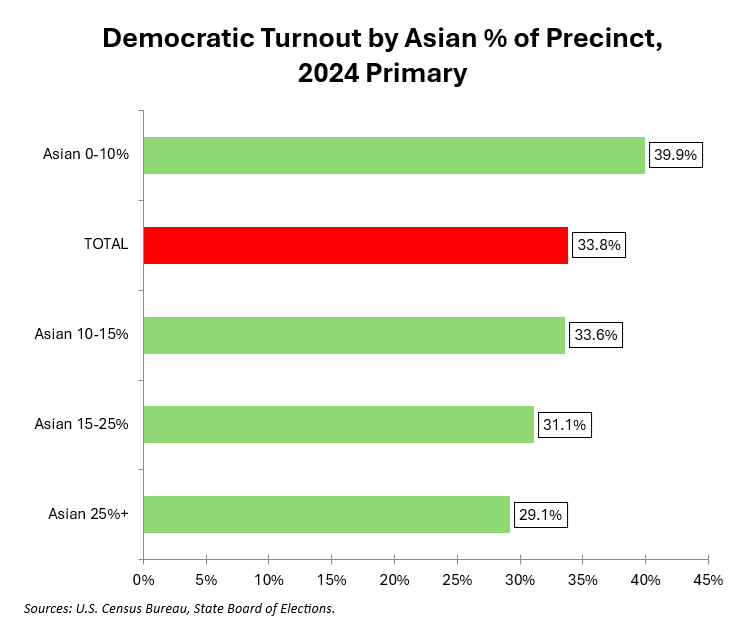
As the Asian population percentage rises, Dem turnout falls. Precincts where Asians account for less than 10% of the population had Dem turnout of almost 40%. Precincts where Asians account for at least a quarter of population had Dem turnout of 29%.
Now let’s run a similar analysis with differing concentrations of Black population.
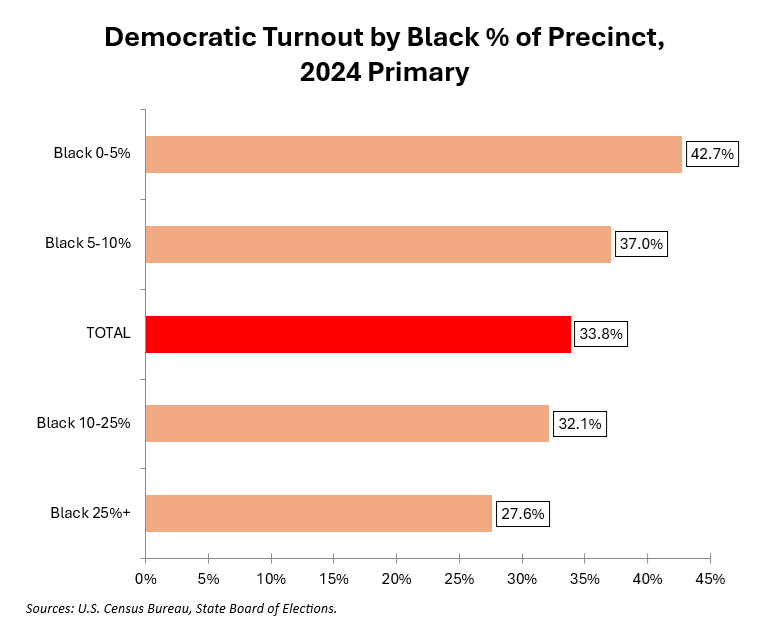
Once again, as the Black population percentage rises, Dem turnout falls. Precincts where Blacks account for less than 5% of the population had Dem turnout of 43%. Precincts where Blacks account for at least a quarter of population had Dem turnout of 28%.
The chart below shows results by concentrations of Latino population.
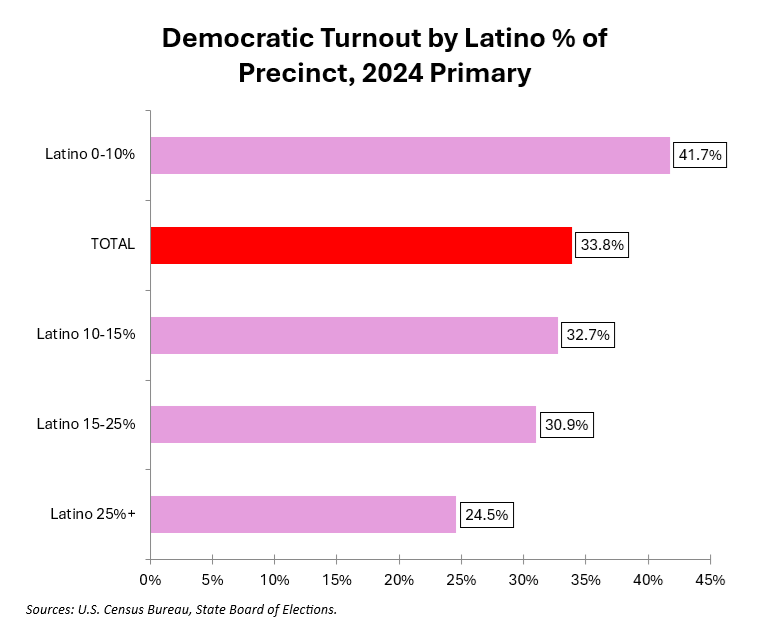
As with Asians and Blacks, as Latino population percentage rises, Dem turnout falls. Precincts where Latinos account for less than 10% of the population had Dem turnout of 42%. Precincts where Latinos account for at least a quarter of population had Dem turnout of 25%.
Now let’s look at concentrations of White population.
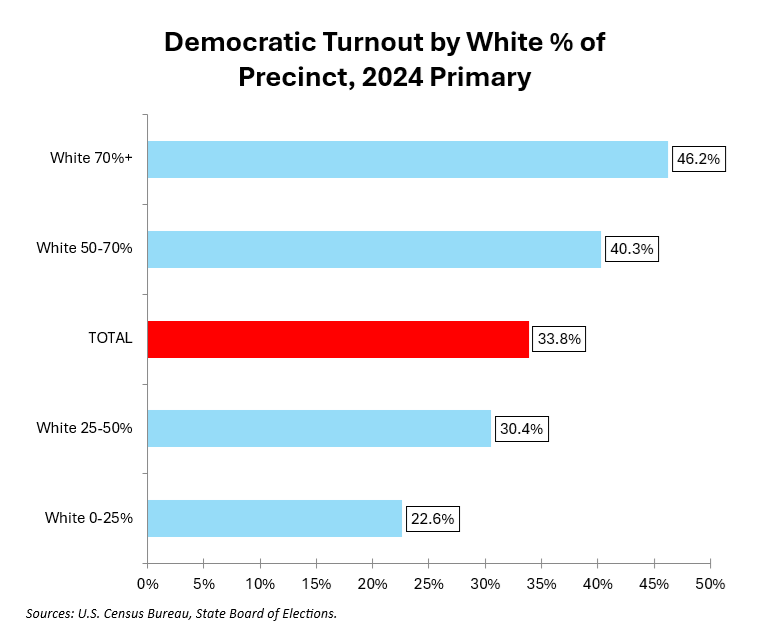
Whites show an opposite trend from the other three groups. As their population share rises, so does Dem turnout. Precincts where Whites account for less than 25% of the population had Dem turnout of 23%. Precincts where Whites account for more than 70% of population had Dem turnout of 46%.
Finally, the chart below shows Dem turnout in the top 25 precincts for each group’s population percentage.
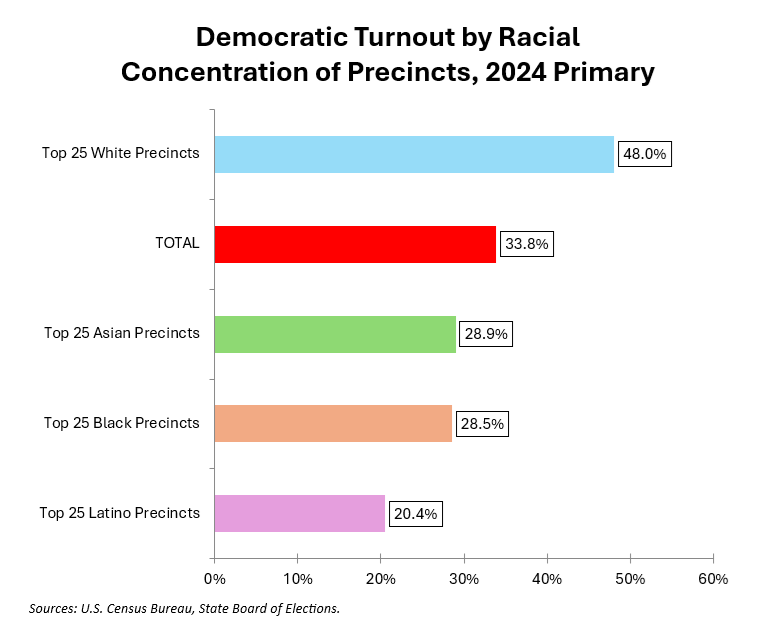
This chart confirms the others: Dem turnout is far higher in heavily White precincts than it is in precincts with large concentrations of other racial groups, with heavily Latino precincts having the lowest turnout.
This data resembles my analysis of 2022 Dem primary turnout. Back in 2011, the Washington Post reported that Montgomery County’s population had become majority non-White and that trend has no doubt intensified since then. But among the county’s kingmakers – its regularly voting primary Democrats – Whites probably remain a majority.
And this phenomenon is sustained by Democratic politicians. Most politicians here target Democrats who regularly or always vote with their communications, especially with mail. (Mailhouses use the voter file and derived databases like MDVAN to specify their targeting universes.)
Voters who receive regular political comms know an election is coming, learn about candidates and are encouraged to vote. Voters who don’t receive these materials know less about the candidates and receive fewer reminders to vote. When the same voters (who are disproportionately White) vote over and over, they receive more comms in future elections, thereby sustaining their voting rate. The opposite is true of voters who don’t receive comms, don’t vote and then continue to be excluded from comms in the future.
This is an inevitable result of limited campaign budgets, a problem experienced by almost all politicians not named David Trone. Politicians are in the business of winning elections, so I can’t blame them for targeting voters who actually vote. But the cumulative impact of this system is to sustain voting dominance by Whites in Democratic primaries despite the rise of non-Whites in the county’s population.
Coming soon: analysis of the U.S. Senate primary and a few stats on the school board elections.