By Adam Pagnucco.
Back in November, Montgomery County voters passed a charter amendment reducing term limits for the county executive from three to two. The amendment prevents County Executive Marc Elrich from running for a third term in 2026, prompting him to announce a council at-large run instead. This series will chronicle the geographic, racial and partisan distribution of voting for term limits at the precinct level.
First, term limits are not unusual in Maryland. Back in 2023, I found that of the state’s ten charter counties (including the City of Baltimore), six (Anne Arundel, Frederick, Howard, Montgomery and Prince George’s counties and Baltimore City) had term limits for both executive/mayor and council, two (Baltimore and Harford counties) had term limits for executive but not council and two (Cecil and Wicomico counties) had no term limits at all. In November, Cecil County voters passed term limits for their executive and Harford County voters passed term limits for their council, both by huge margins. MoCo voters are not alone in desiring term limits.
The percentage of MoCo voters approving term limits in 2024 (67.4%) was almost equal to the percentage approving term limits in 2016 (69.8%). Despite their similar margins of passage, the two charter amendments are different. The 2016 amendment first established term limits for the executive and the council at three consecutive terms each. The 2024 amendment reduced term limits for the executive from three to two. The difference in effect between the amendments does not seem to have substantially affected voter support.
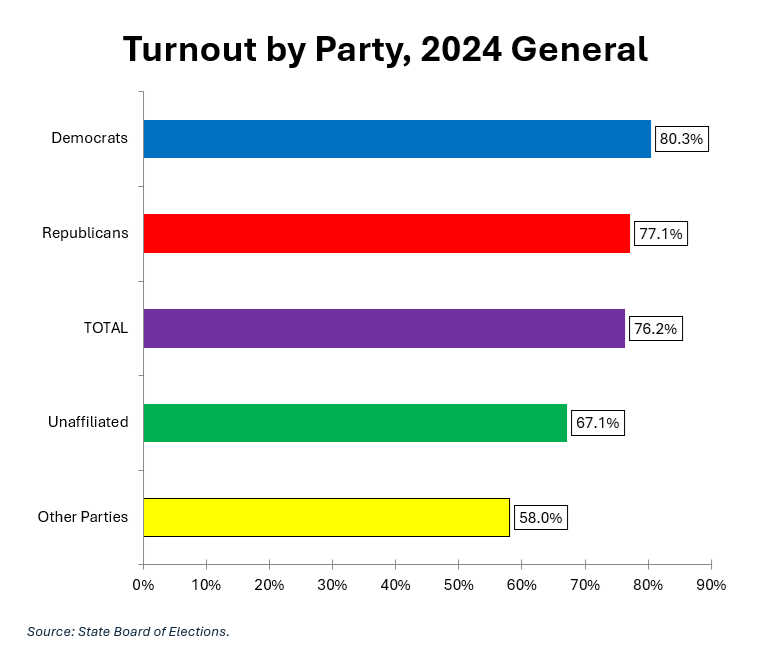
Before analyzing the distribution of term limits voting, let’s look at MoCo’s turnout by party in November. The chart below shows turnout rates by party affiliation in MoCo’s 2024 general election.
Democrats are the largest group in the county’s electorate and also had the highest turnout rate. The pie chart below shows the party composition of those who cast votes in MoCo’s 2024 general election.
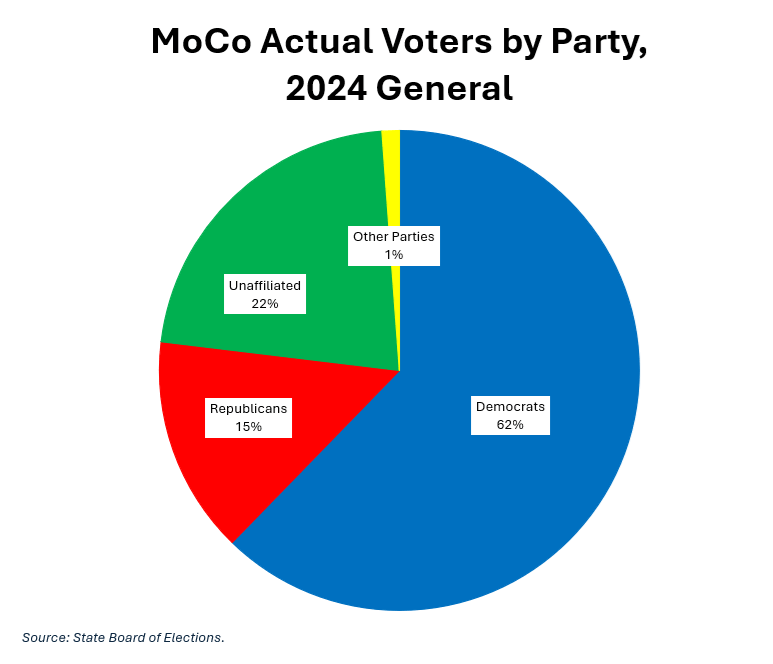
The county electorate that passed term limits again had a super-majority of Democrats, many of whom voted to reduce term limits for a Democratic county executive. Here’s how the math works. Term limits passed with 67% of the vote. Democrats accounted for 62% of the electorate. If all non-Democrats voted for term limits, that means 48% of the Democrats also voted yes to achieve a support level of 67%. If 90% of the non-Democrats voted yes, then 54% of Democrats must have voted yes to get to 67% overall.
The above illustrates that term limits could not have achieved the percentage they did without substantial Democratic support. We will return to this point later in the series.
We will examine geography next.