By Adam Pagnucco.
In Part One, we showed that a substantial number of Democratic voters approved reducing term limits for a Democratic county executive. Part Two looked at geography. Part Three looked at race. Now let’s examine the impact of political parties.
The State Board of Elections has released precinct data on both voting results and turnout by party in the 2024 general. When using those data series together, it’s possible to evaluate how different compositions of voters by party associated with levels of term limits support.
Let’s start with Democrats, who comprised 62% of the 2024 general electorate. The chart below shows how precincts with different percentages of Democrats among all voters voted for term limits.
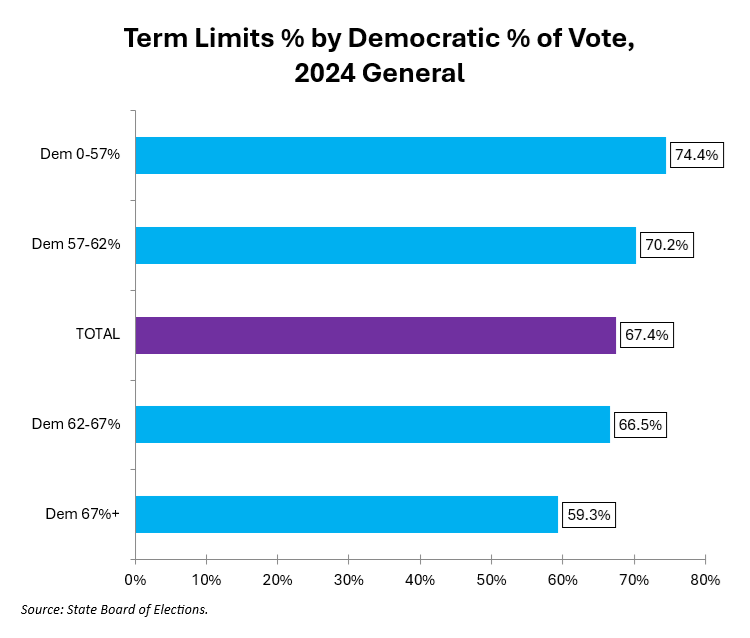
Precincts with Democrats accounting for more than 67% of voters had a combined 59% support for term limits. On the other side, precincts with Democrats accounting for less than 57% of voters had a combined 74% support for term limits. As Democratic concentration increased, term limits support declined.
Now let’s look at Republican concentrations in precincts.
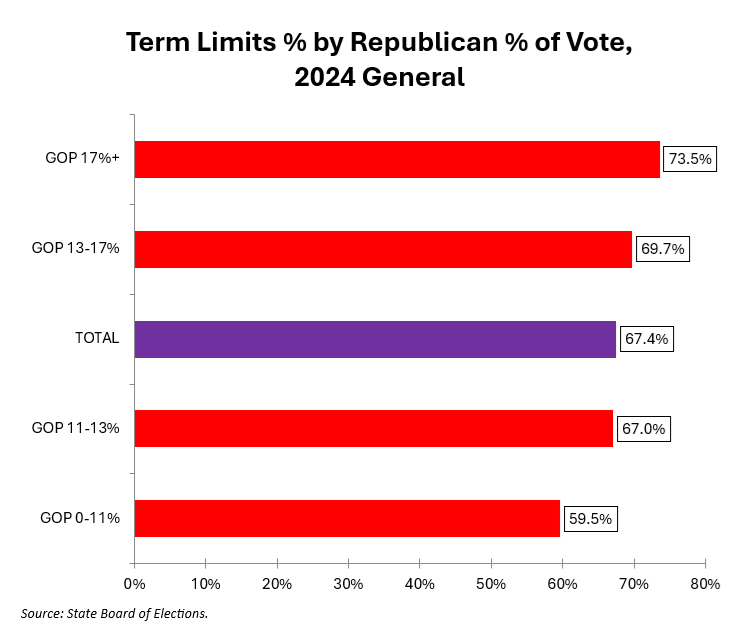
Republicans showed the opposite trend from Democrats. As Republican percentage of precinct voting increased, so did support for term limits.
This chart looks at unaffiliated voter concentrations in precincts.
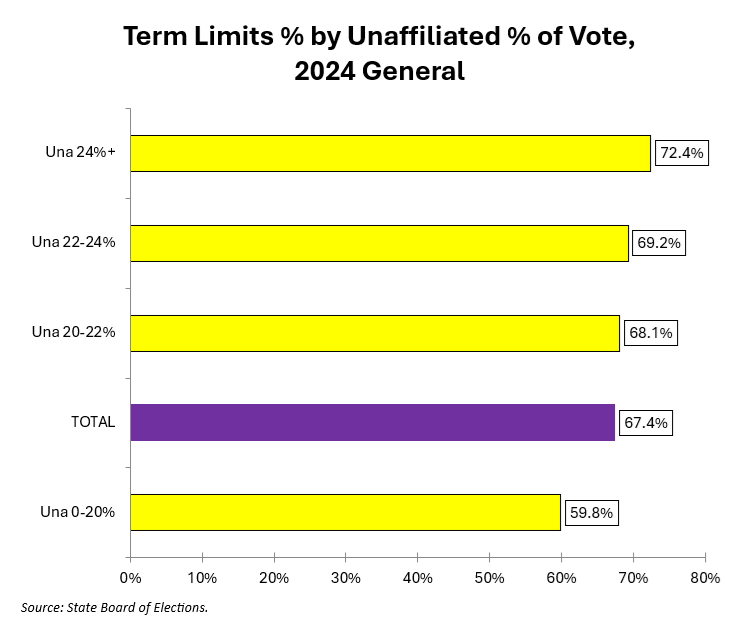
Unaffiliated concentrations behaved like Republican concentrations: as the percentage of unaffiliated voters climbed, so did support for term limits.
Now let’s look at the 25 precincts with the highest concentrations of each party.
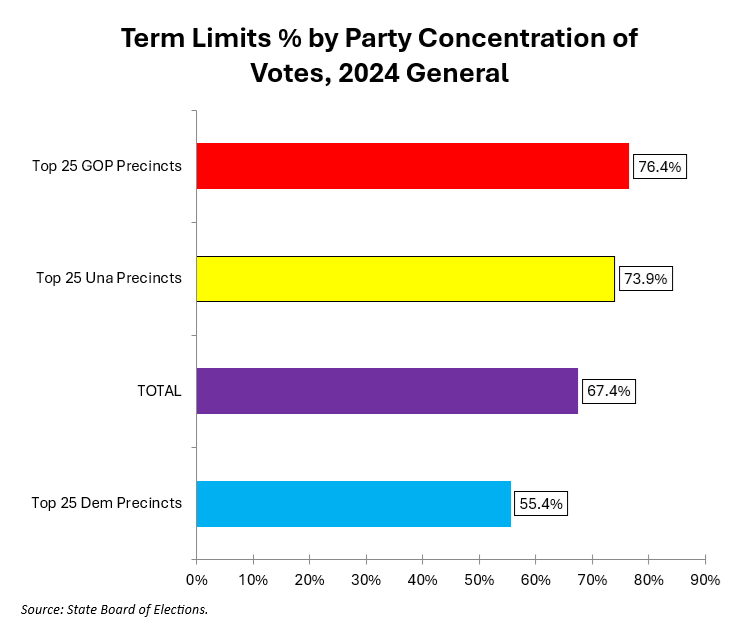
This chart confirms the above charts: heavily Republican and unaffiliated precincts supported term limits much more than heavily Democratic precincts. However, even strongly Democratic precincts still supported term limits overall.
Correlation coefficients between precinct party concentration and term limits support percentage confirm this partisan relationship. Democratic percentage of voters had a -0.78 correlation with term limits support, a strong negative relationship. Republican percentage of voters had a +0.65 correlation with term limits support, a moderate positive relationship. And unaffiliated percentage of voters had a +0.58 correlation with term limits support, a moderate positive relationship.
Partisan affiliation was clearly a factor in term limits support. But let’s restate this analysis from Part One: term limits could never have passed without substantial support from Democrats.
The county electorate that passed term limits again had a super-majority of Democrats, many of whom voted to reduce term limits for a Democratic county executive. Here’s how the math works. Term limits passed with 67% of the vote. Democrats accounted for 62% of the electorate. If all non-Democrats voted for term limits, that means 48% of the Democrats also voted yes to achieve a support level of 67%. If 90% of the non-Democrats voted yes, then 54% of Democrats must have voted yes to get to 67% overall.
And so term limits have proven their popularity in Montgomery County once again, primarily because Democrats supported them (although at a lower rate than Republicans and unaffiliated voters). If deep blue Montgomery County can support term limits with two-thirds of the vote twice in a decade, they should be able to pass almost anywhere.
Luckily for the General Assembly, Maryland does not allow citizen initiatives that would change its state constitution, a likely requirement for statewide term limits.