By Adam Pagnucco.
In Part Seven, we learned that zip codes with high percentages of Asian, Black and Latino residents disproportionately did not contribute to publicly financed candidates. Let’s look at three more demographic measures based on data from the U.S. Census Bureau’s 2017-21 American Community Survey.
The chart below reports per capita in-county individual contributions by zip code percentage of White residents. Zip codes with the highest White percentages are 20839 in Beallsville (close to 100%), 20896 in Garrett Park (89%), 20812 in Glen Echo (85%), 20838 in Barnesville (80%) and 20816 in Bethesda (80%). Zip codes with the lowest White percentages are 20904 in Silver Spring East County (22%), 20877 in Gaithersburg (21%), 20899 in Gaithersburg (18%), 20866 in Burtonsville (15%) and 20903 in Silver Spring East County (10%).
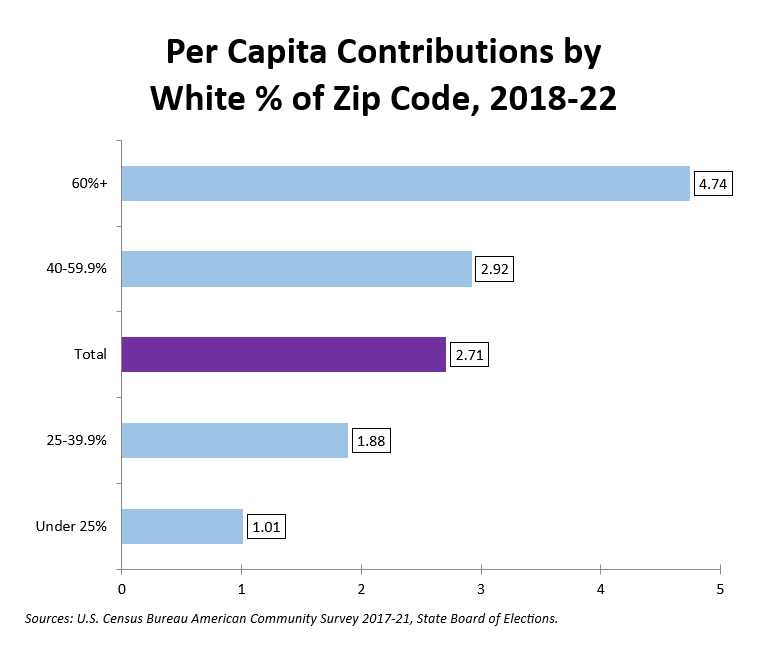
White percentage has a strong positive correlation with contributions to publicly financed candidates. This is driven partly by high contribution rates from Bethesda, Chevy Chase and Kensington, all of which have White population percentages of 60% or higher.
Now let’s look at population density per square mile. Zip codes with the highest number of residents per square mile are 20910 in Silver Spring Downtown (9,859), 20912 in Takoma Park (9,776), 20903 in Silver Spring East County (7,420), 20886 in Montgomery Village (7,356) and 20902 in Wheaton (7,052). Zip codes with the least number of residents per square mile are 20868 in Spencerville (311), 20837 in Poolesville (155), 20838 in Barnesville (134), 20842 in Dickerson (34) and 20839 in Beallsville (33).
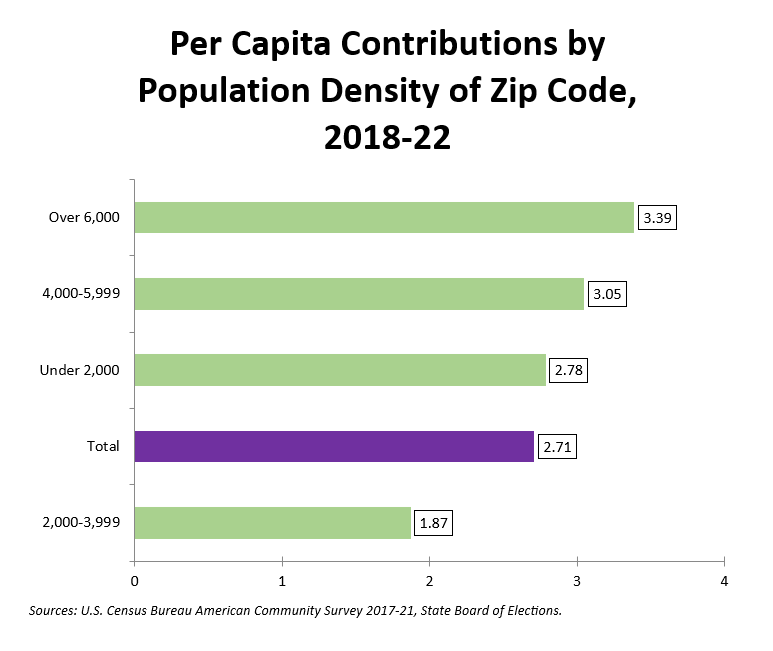
There is a modest correlation between population density and contribution rate. This is primarily due to lots of contributions from the Democratic Crescent (Downcounty), which contains dense population centers in Silver Spring Downtown, Takoma Park, Chevy Chase and Bethesda.
Finally, let’s look at median household income. Zip codes with the highest median household incomes are 20896 in Garrett Park ($241,875), 20817 in Bethesda ($217,674), 20854 in Potomac ($217,477), 20816 in Bethesda ($213,828) and 20818 in Cabin John ($205,391). Zip codes with the lowest median household incomes are 20906 in Glenmont/Norbeck ($84,909), 20877 in Gaithersburg ($77,264), 20903 in Silver Spring East County ($74,607), 20912 in Takoma Park ($67,427) and 20899 in Gaithersburg (mean income of $33,970).
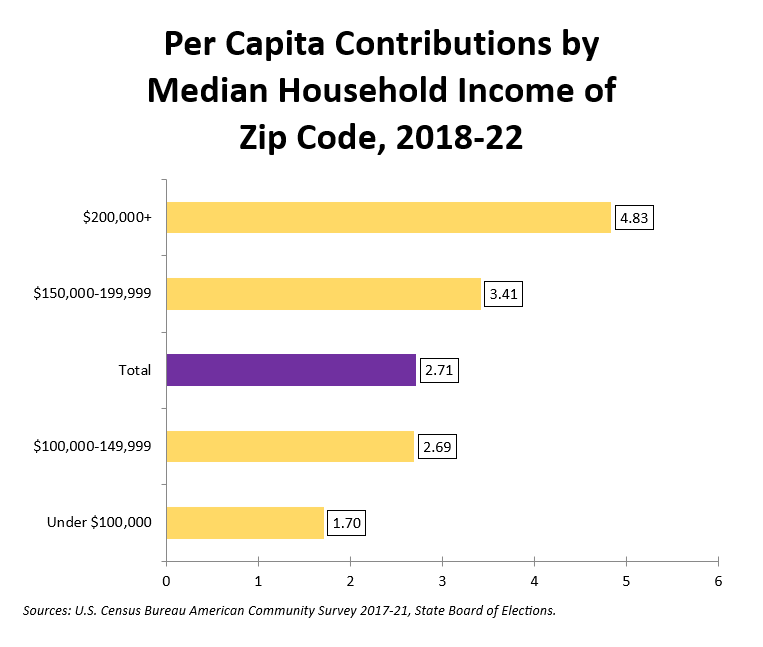
This correlation is clear and strong. Wealthier zip codes have higher contribution rates than less affluent ones in public financing.
In this part and Part Seven, we learned that contributions in public financing are positively correlated with high White population percentage, dense areas and wealthy areas and negatively correlated with high Asian, Black and Latino population percentages. This is probably true of all campaign financing regimes but public financing does not appear to have broken that pattern.