
By Adam Pagnucco.
Part One covered the methodology of this series. Part Two covered total employment. Part Three examined private employment. Part Four looked at establishments. Part Five looked at real total wages paid. Today, let’s look at data from the U.S. Bureau of Labor Statistics on real total wages paid per job in the D.C. region’s ten largest jurisdictions.
Our first chart compares MoCo to our competitors in wages paid per job in 2024.

MoCo trails the region total by a bit but that’s primarily because it is skewed by D.C. and Arlington. We lead most of our neighbors. With the exception of Prince George’s County, this stat tends to decline the further a jurisdiction is from D.C.
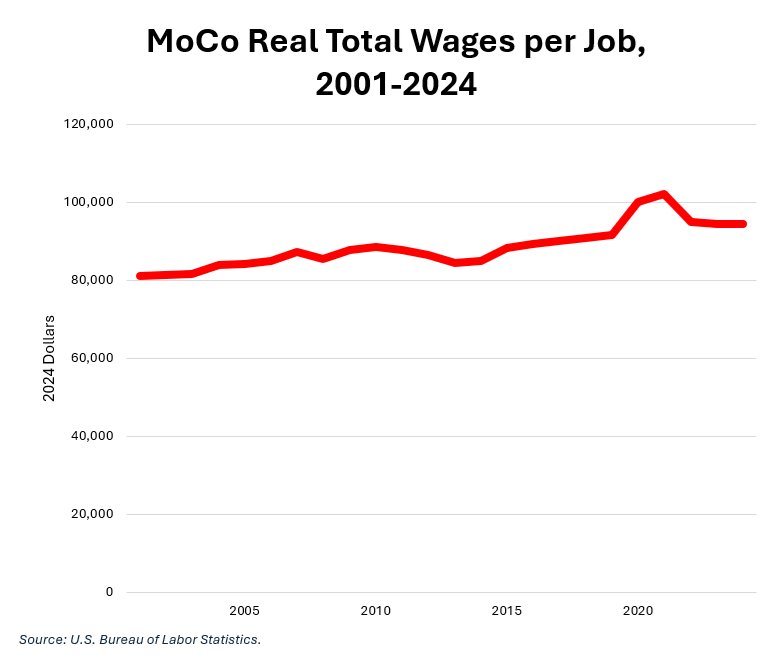
The chart below shows MoCo’s real total wages paid per job since 2001, the first year in this series. The trend is mostly up with the notable exceptions of the Great Recession and its aftermath and the pandemic.
The chart below shows one-year growth of real total wages paid per job in 2024 for MoCo and the other nine large jurisdictions in the region.
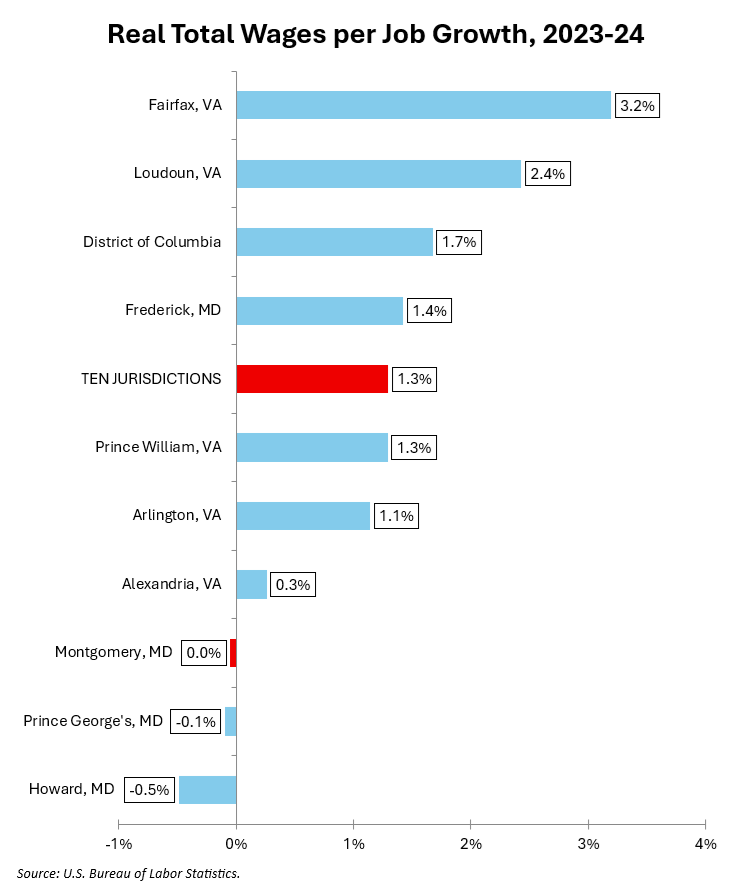
We were one of three jurisdictions to see a real wage drop in 2024, although ours was less than 1%.
The chart below shows 2024 real wages per job as a percentage of 2019 real wages. This measures the degree to which each jurisdiction has bounced back from the pandemic.
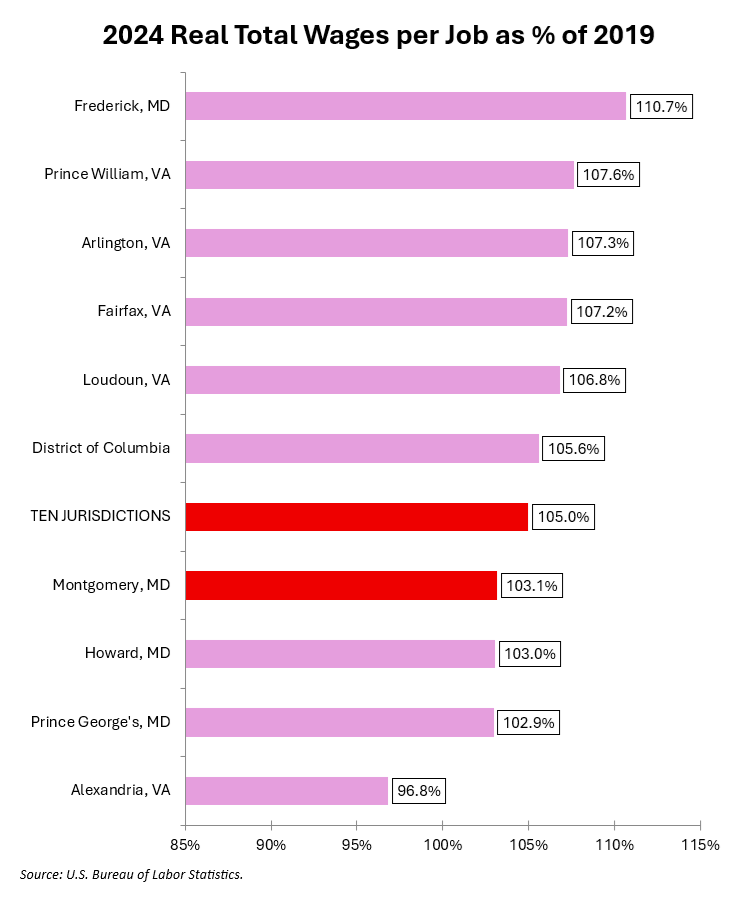
We were slightly below the region total.
Finally, the chart below shows real wages per job growth from 2007 (the year before the Great Recession) to 2024.
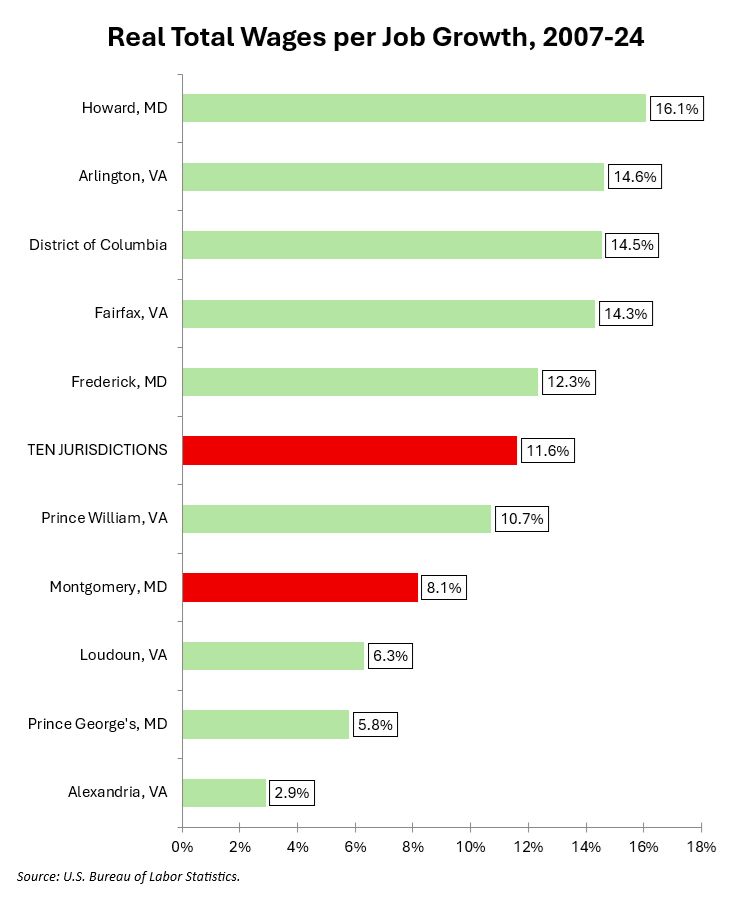
We trailed the region total and lagged six of our nine competitors.
Real total wages paid per job is slightly better for us than total real wages paid because it doesn’t take into account our minimal job growth. Even so, we’re below average.
Next: labor market exposure to the federal government.