
By Adam Pagnucco.
Part One covered the methodology of this series. Part Two looked at total employment. Now let’s look at federal government employment.
No one reading this column would disagree that the presence of federal government jobs – and related contractor jobs – has historically been a huge asset for MoCo and the entire region. Let’s start with the chart below, which shows federal government employment as a percentage of total employment for the region’s ten largest jurisdictions in 2024. Because this is 2024, this is a measure applying to the year before President Donald Trump resumed office and began cutting federal jobs.

Among the ten largest jurisdictions, we ranked fourth in the federal government’s percentage of our jobs base. Earlier this year, I reported that these jobs paid unusually well compared to other sectors – making them critical to our economy.
Now let’s look at the level of federal government employment in MoCo from 2001 through 2025.

There were a couple small dips, but generally, MoCo’s federal jobs base rose from roughly 40,000 to 50,000 over most of the period. And then – BAM! – the Trump decline. And let’s remember – federal contracting jobs are not in this series.
Here is the percentage change in federal government employment by jurisdiction last year.

We got clobbered. In percentage terms, only Howard County fared worse. But refer to the chart at the start of this column and you will see that federal jobs are a far smaller portion of Howard’s jobs base than ours.
The chart below shows federal government job losses last year. The negative number for Alexandria is a gain.
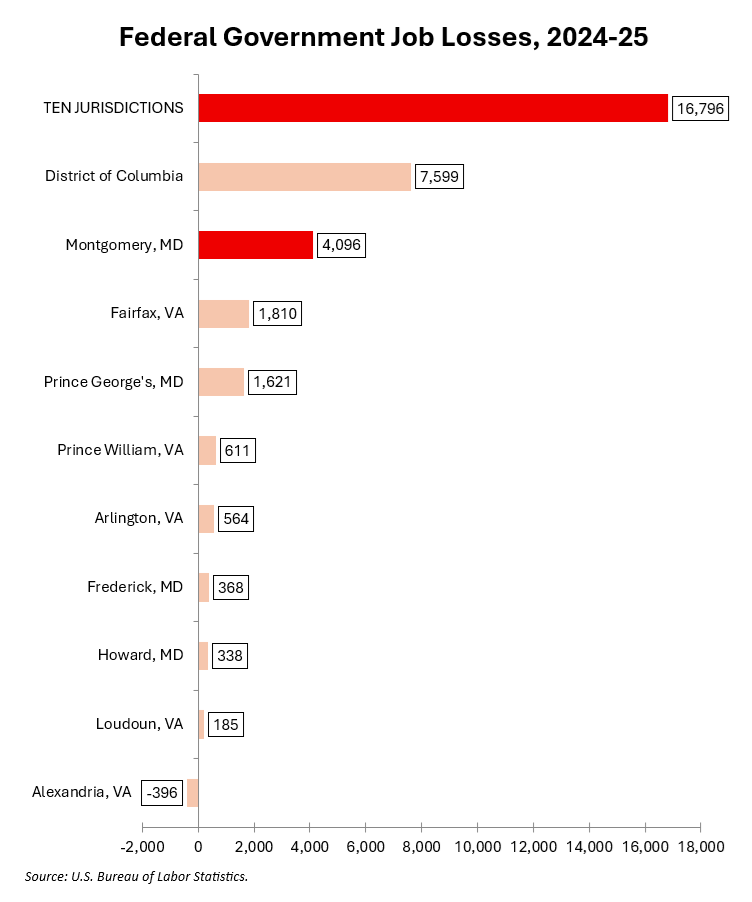
Only D.C. lost more federal jobs than we did. No other jurisdiction compares to us on this measure.
So MoCo’s leaders have a point that the Trump administration has wreaked especially grievous amounts of damage on us, even compared with most of our neighbors. But there is a lot more going on, especially over the long term.
Next: private sector employment.