
By Adam Pagnucco.
Part One explained the methodology of this series, which looks at U.S. Census data on residential addresses to approximate housing units. Part Two looked at residential address count growth in D.C., Maryland and Virginia. Now let’s get more local.
The chart below shows residential address count growth in each of Maryland’s 24 local jurisdictions between April 2020 and July 2025. MoCo and statewide growth appear in purple bars. Jurisdictions in red bars have at least 100,0000 residential addresses.
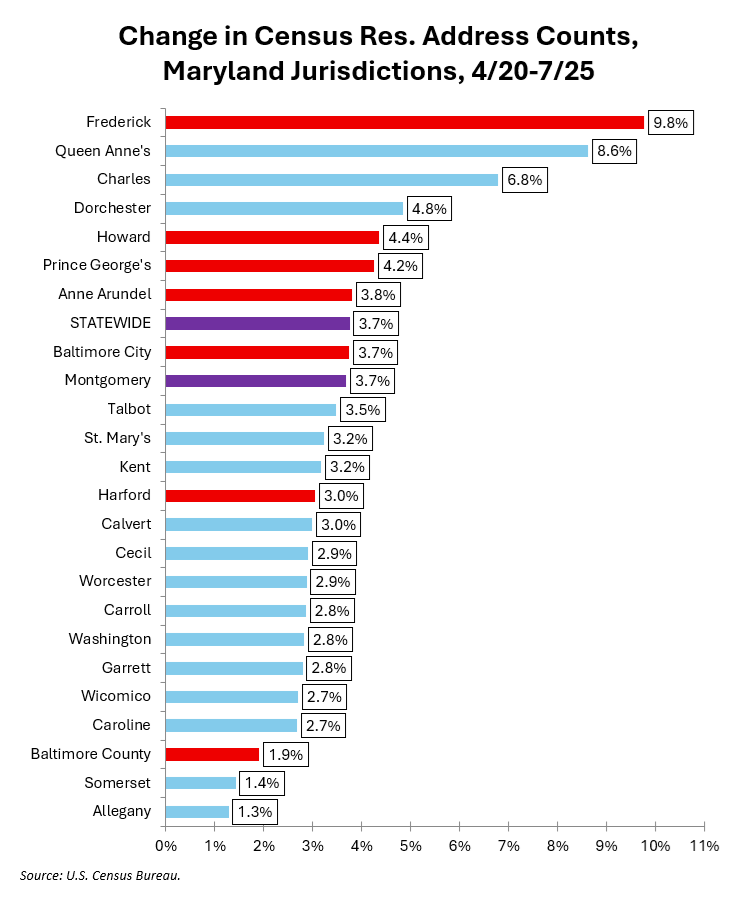
MoCo’s growth rate was close to the state total. Among large jurisdictions, MoCo surpassed Harford and Baltimore counties but trailed the others (especially Frederick).
Now let’s look at the local jurisdictions in the Washington-Arlington-Alexandra metro area. Again, the region total and MoCo are in purple while other jurisdictions with at least 100,000 residential addresses are in red.
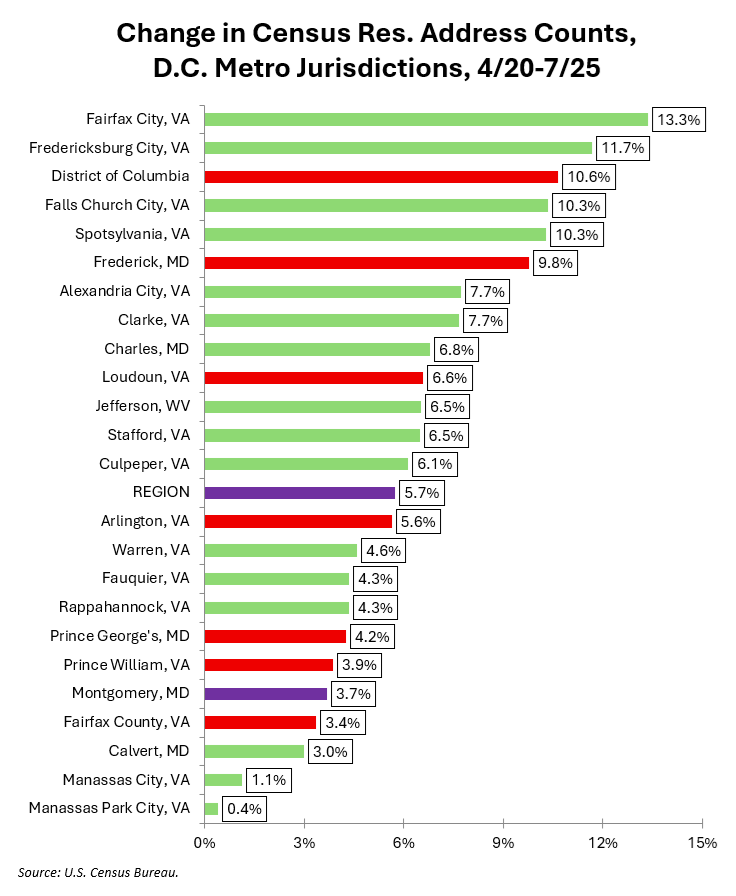
The Washington region’s address growth rate (5.7% over five-plus years) is higher than Maryland’s (3.7%) because of D.C. and some of Virginia’s exurbs. MoCo’s rate (3.7%) is lower than the region average and lower than all of its large competitors except for Fairfax County. This performance mirrors MoCo’s comparative weakness across many economic indicators.
That said, there are significant differences in address growth inside MoCo. We will begin exploring them next.