By Adam Pagnucco.
Part One explained the methodology of MCPS’s staff climate survey. Part Two summarized some stats from FY23. Part Three looked at five survey questions on which MCPS did well. Part Four looked at five survey questions on which MCPS did not do well. Today, we will discuss variation of responses among high schools.
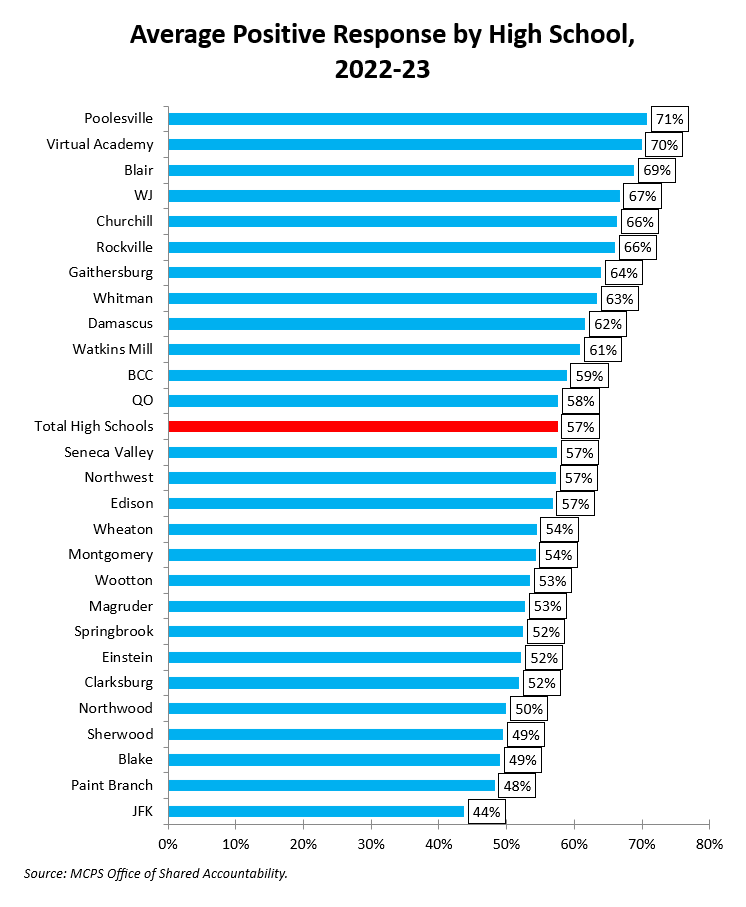
MCPS reported survey responses by school. These included responses for 28 high schools, including Thomas Edison HS and a virtual academy. The chart below shows average positive response by high school.

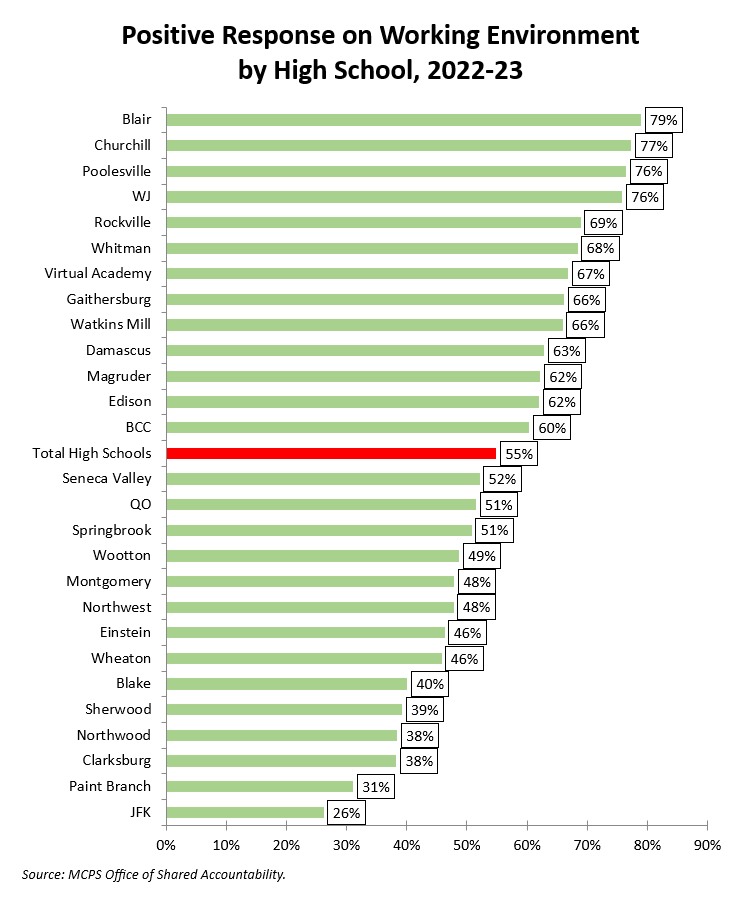
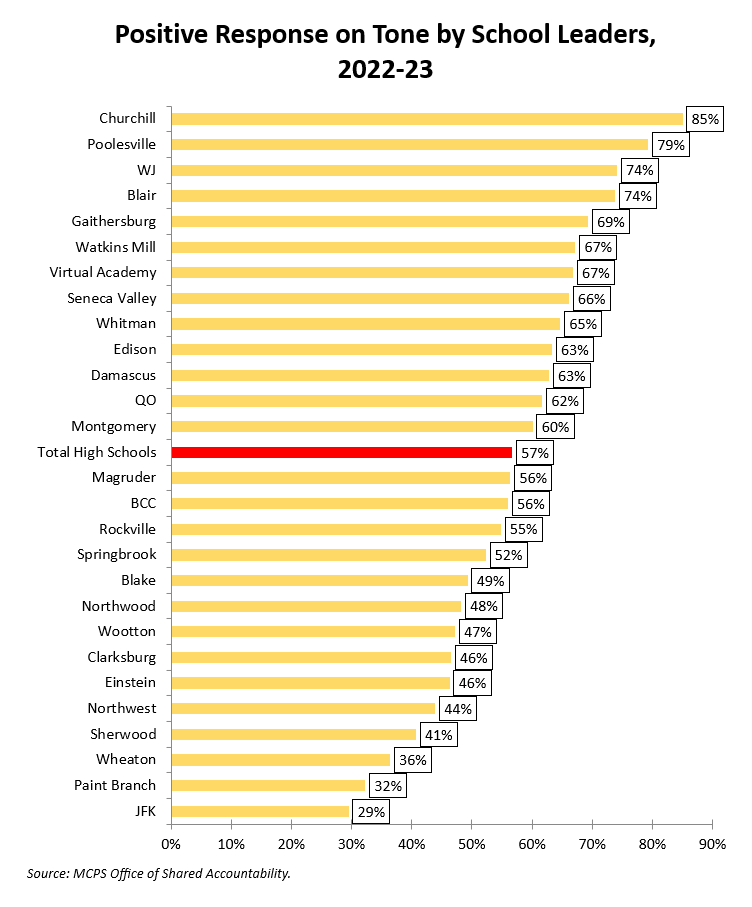
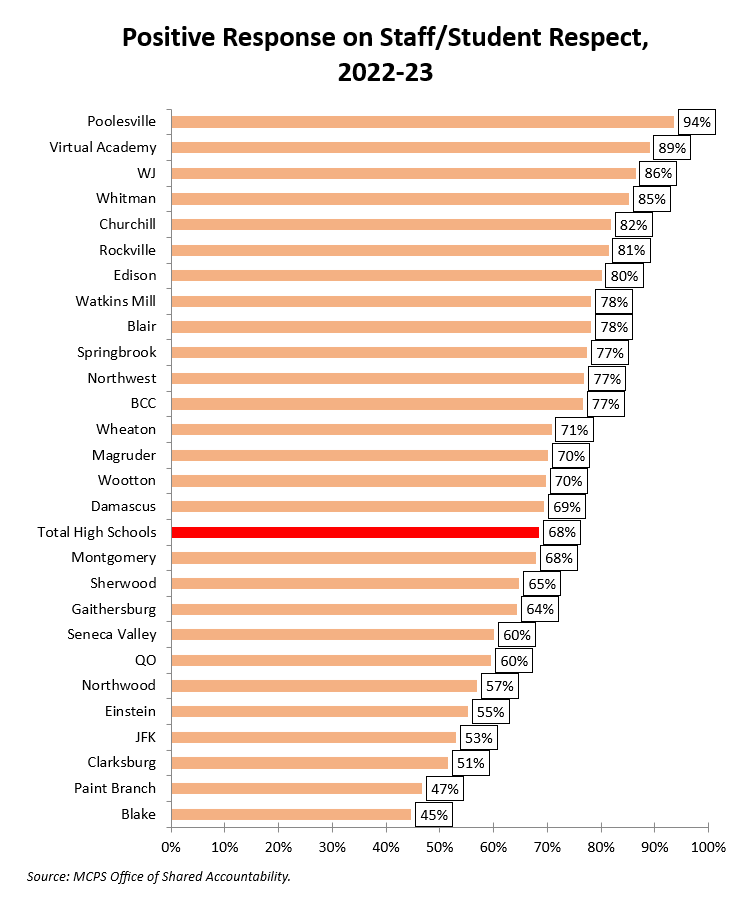
The variation here is easy to see, with some schools being 20 points+ more positive than others. That variation is even bigger on some questions. The three showing the most variation are shown below.
Q: Overall, how positive is the working environment at your school?

Q: How positive is the tone that school leaders set for the culture of the school?

Q: How respectful are the relationships between staff and students?

It’s a bit disturbing to see lower rates of positive responses in schools with substantial Black and Brown student populations like Kennedy, Paint Branch, Blake, Northwood and Einstein while White-majority or plurality schools in the W cluster fare better. (Blair, an extremely diverse school in Silver Spring, is an exception.) What is going on here? If I were in MCPS leadership, I would want to know that.
Is there a pattern behind these results? We will get into that next.
