By Adam Pagnucco.
Part Two revealed that Montgomery County has long suffered net out-migration of tax returns and real adjusted gross income (AGI) with those trends intensifying in the last six years. What explains this trend?
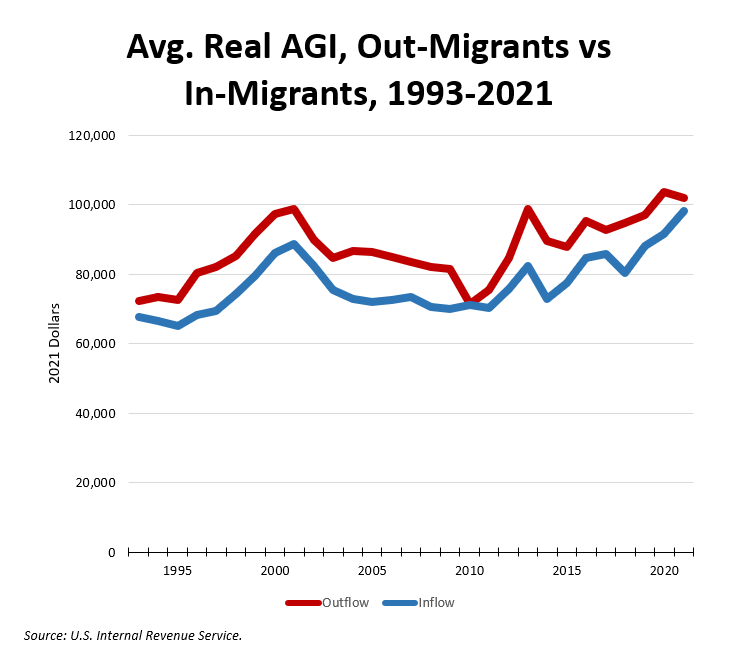
The chart below shows the average real AGI in 2021 dollars of in-migrants and out-migrants from 1993 through 2021.

In every single year of the series, the average AGI of out-migrants is higher than the average AGI of in-migrants. This means people moving into Montgomery County make less than folks moving out. In the last ten tax years, out-migrants averaged real AGI of $94,969 vs $84,009 for in-migrants. That’s a 13 percent differential. Combine that with a rise in net returns migrating out and it’s a double-whammy on our taxable income base.
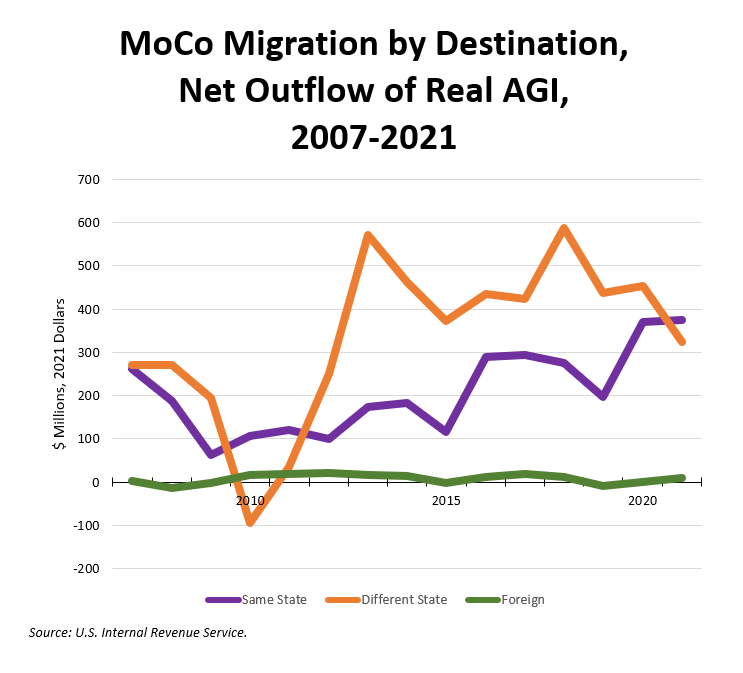
The IRS series shows income destinations of states and counties. It also contains three broad geographic categories – migration to and from the same state, different states and foreign countries. The chart below shows net loss of real AGI (2021 dollars) to each of those geographies. I am picking 2007 as a base year because that is the year before the Great Recession hit, an event that was a turning point in MoCo’s economy.

AGI losses to the rest of Maryland have occurred in every year of the series. MoCo gained net AGI from other states in 2010, but since then it has usually lost even more AGI to other states than it has to the rest of Maryland. Foreign AGI losses are relatively minor. In five of this series’ last fifteen years, MoCo actually gained AGI on net from foreign locations.
Now the foreign data has a big caveat: this series consists of taxpayers known to the IRS who can be tracked across jurisdictional lines. Residents who do not file income tax returns are not included. It’s not clear whether legal residents who move here from foreign countries are always included either. This data could disproportionately reflect U.S. citizens who move to or return from foreign locations and file U.S. taxes. In any event, the county could conceivably have net positive in-migration of foreigners as it has over the last two years and have net out-migration of AGI to foreign countries among residents who are trackable by the IRS.
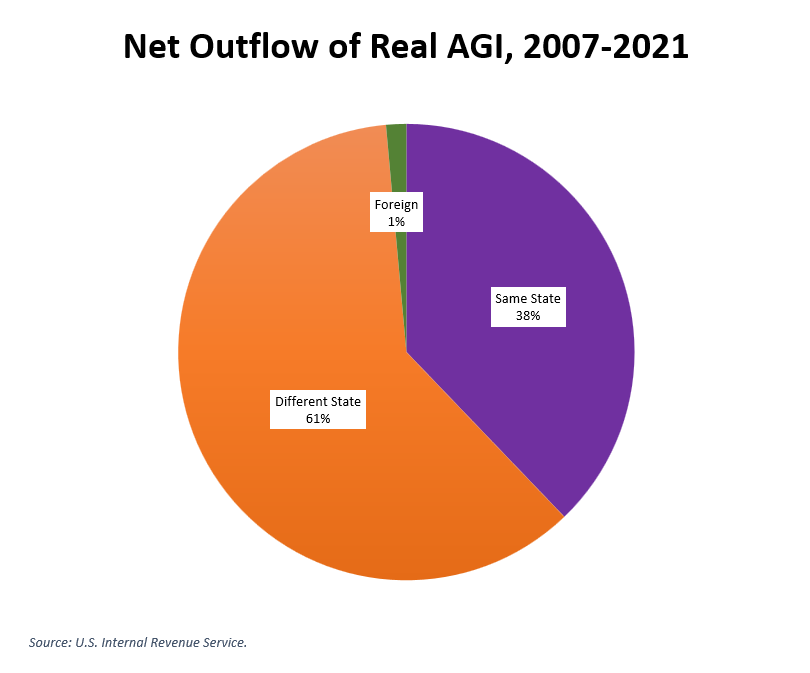
Finally, the pie chart below shows the components of net out-migration of AGI from 2007 through 2021.

And so there is no single location that explains MoCo’s net loss of taxpayer income. There are actually many locations. We will start naming them in Part Four.
