By Adam Pagnucco.
In Part One, we showed that a substantial number of Democratic voters approved reducing term limits for a Democratic county executive. Now let’s look at geography. The terms used in this post are defined in my column on methodology.
First, the chart below shows term limits support by region.
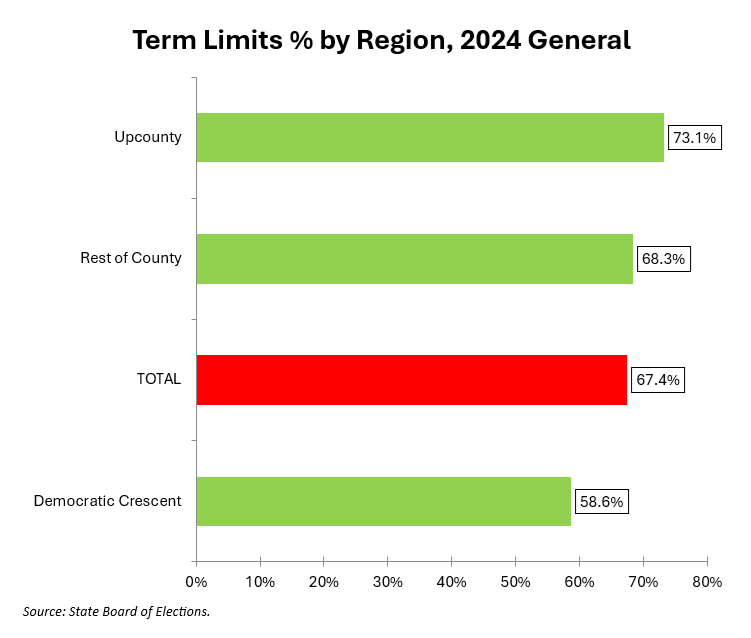
While term limits had majority support in every region, they had the least support in the Democratic Crescent, the heavily Democratic Downcounty areas that originally sent Jamie Raskin to Congress. That’s no accident as we will explain later in the series.
Now let’s look at congressional, state and council districts.
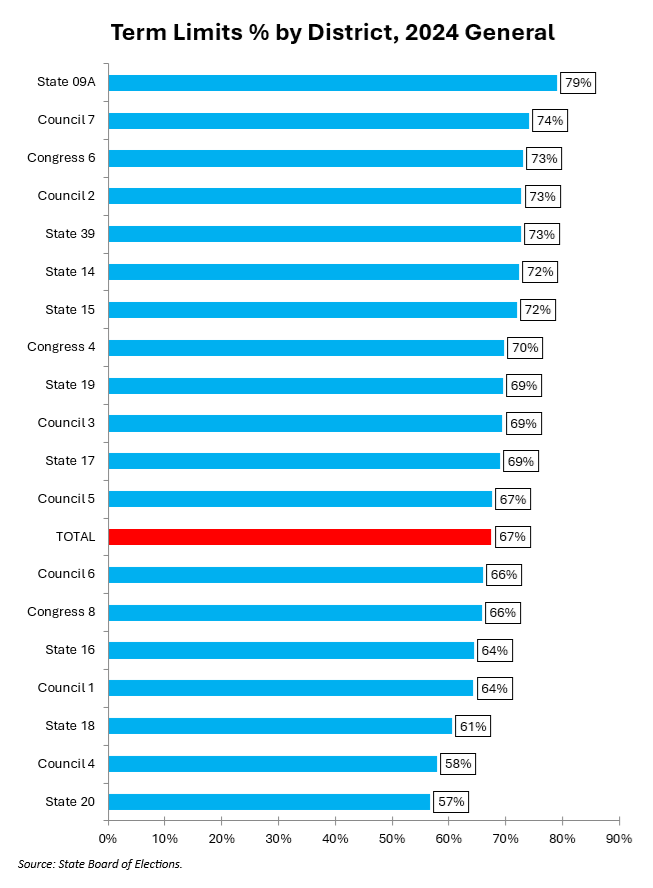
Term limits had the most support in the far northern and western districts and the least support in the south. But every congressional, state and council district in the county still voted yes.
This chart shows term limits support by local area as defined in my methodology post.
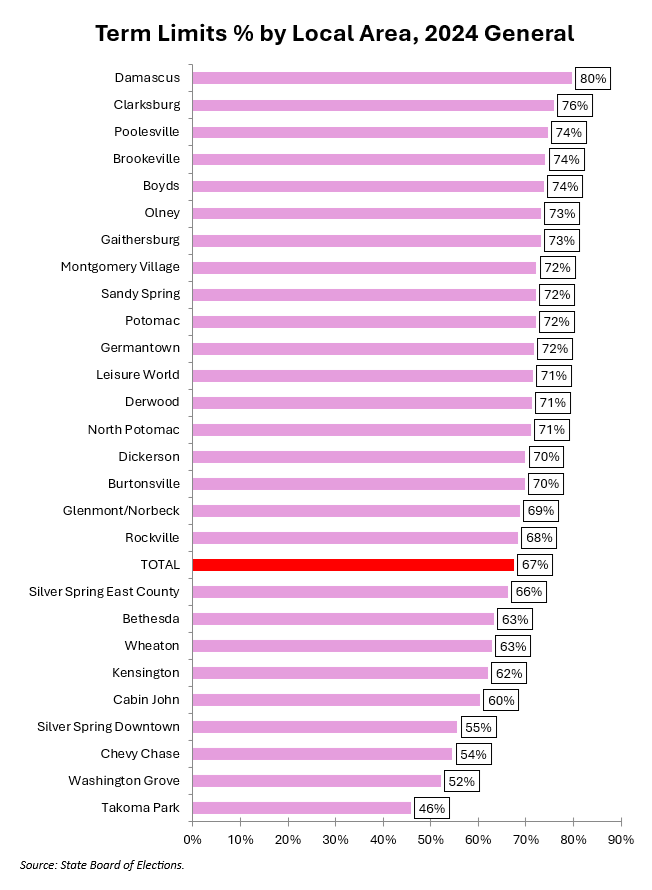
Only Takoma Park, the most progressive local area in Montgomery County (and possibly the state) voted against term limits. Support levels of 70% or more were common.
Of the county’s 257 precincts, only eight voted against term limits. Of those, 3 were in Takoma Park, 2 were in Chevy Chase, 2 were in Silver Spring Downtown and 1 was in Bethesda. In contrast, 32 precincts recorded support for term limits of 75% or more.
While support for term limits was strong, it was not monolithically strong everywhere. We will look at the role of race next.