By Adam Pagnucco.
In Part One, we showed that a substantial number of Democratic voters approved reducing term limits for a Democratic county executive. Part Two looked at geography. Now let’s look at race.
My methodology post outlined how I used U.S. Census data on race by precinct to map racial distributions of precinct results. I also identified the 25 precincts with the highest concentrations of each major racial group. Here is where each of those precinct groups is located.
Top 25 Asian precincts: Clarksburg (6 precincts), Potomac (5), Rockville (5), Germantown (3), North Potomac (3), Gaithersburg (2), Boyds (1).
Top 25 Black precincts: Silver Spring East County (11 precincts), Silver Spring Downtown (7), Glenmont/Norbeck (3), Wheaton (2), Burtonsville (1), Takoma Park (1).
Top 25 Latino precincts: Gaithersburg (8 precincts), Glenmont/Norbeck (7), Rockville (3), Montgomery Village (2), Silver Spring Downtown (2), Wheaton (2), Germantown (1).
Top 25 White precincts: Bethesda (6 precincts), Chevy Chase (5), Gaithersburg (2), Kensington (2), Leisure World (2), Poolesville (2), Dickerson (1), Olney (1), Rockville (1), Silver Spring East County (1), Washington Grove (1), Wheaton (1).
The chart below examines support for term limits in different levels of Asian population concentration in precincts.
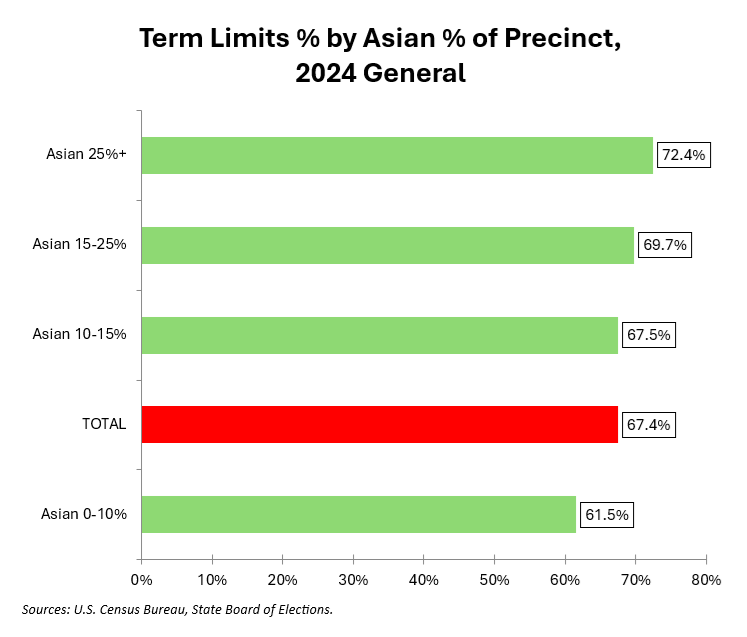
There is an apparent correlation here as rising levels of Asian population percentage are associated with rising support for term limits. We will discuss this further below.
Now let’s look at Black population concentrations.
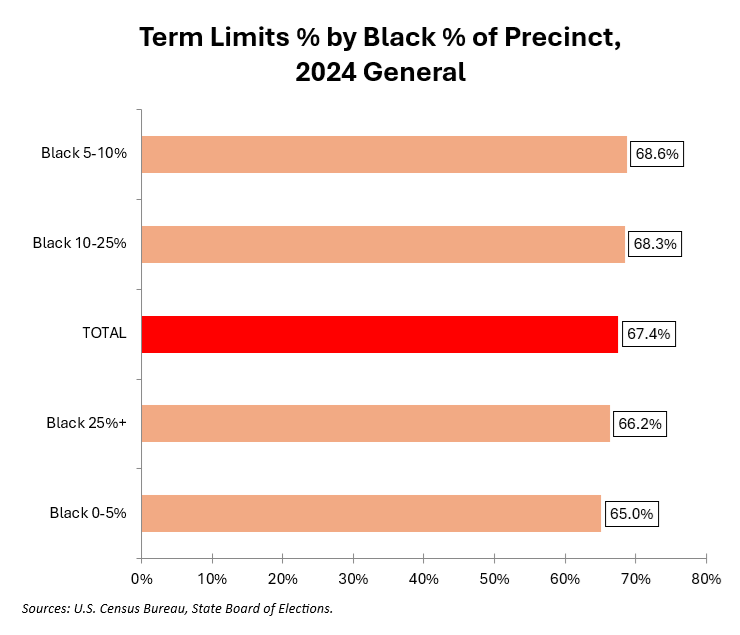
Black percentage appears to make almost no difference in term limits support.
This chart looks at Latino population concentrations.
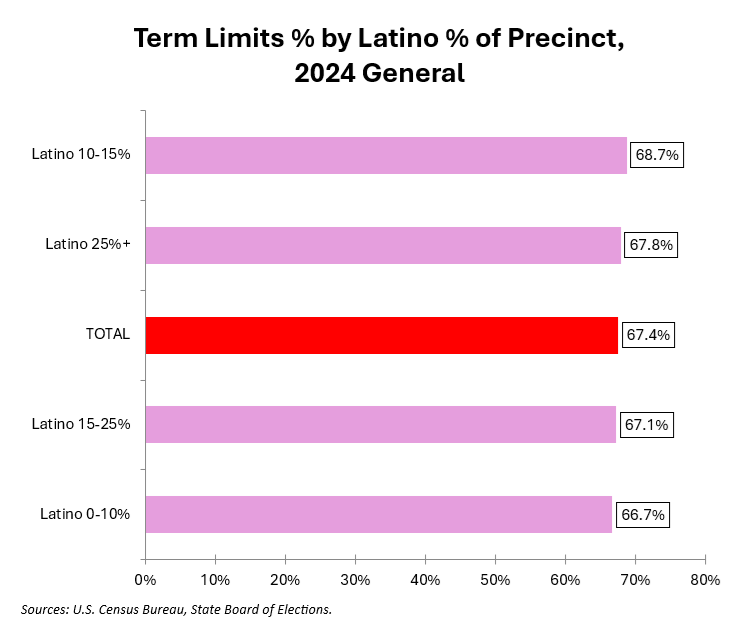
Again, Latino percentage appears to make no difference.
Now let’s examine White population concentrations.
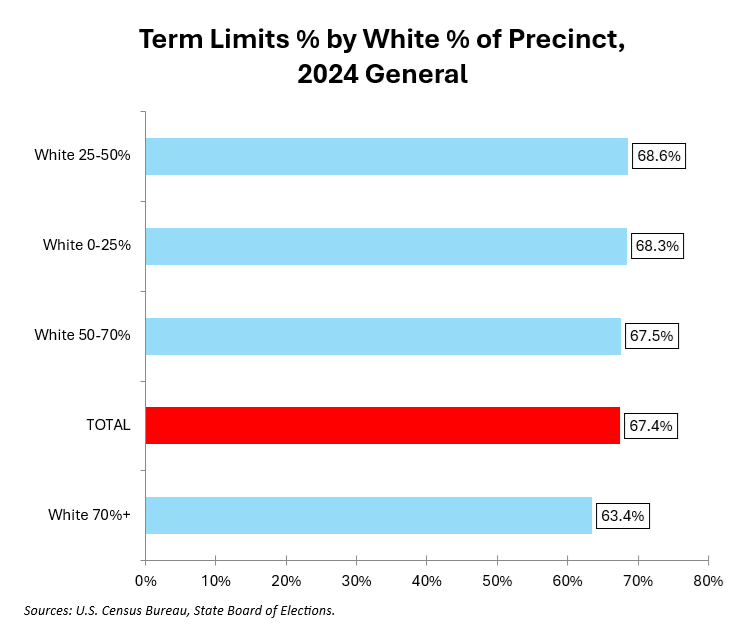
White percentage appears to make little difference aside from a drop in term limits support in heavily White precincts. This probably reflects less popularity for term limits in heavily White – and also heavily Democratic – precincts in Chevy Chase, Kensington and Bethesda as shown in Part Two.
This chart shows term limits support in the top 25 precincts for each racial group.
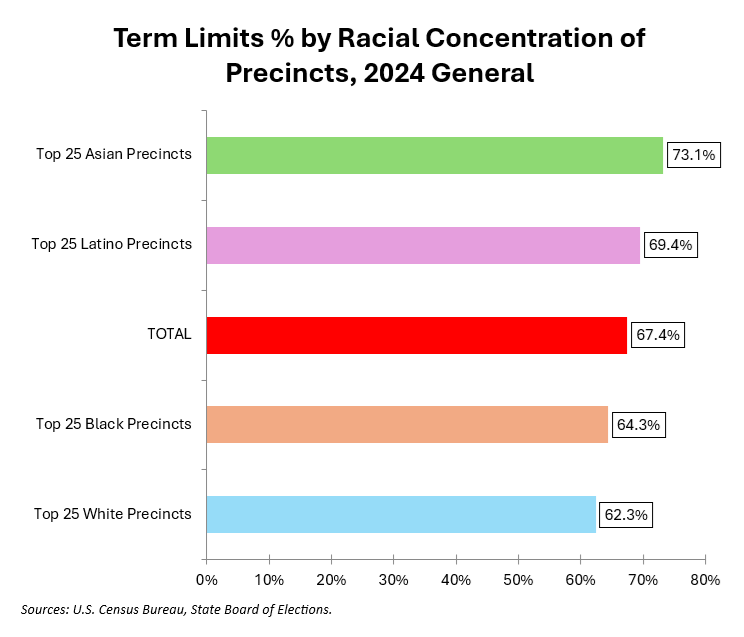
Once again, heavily Asian precincts stand out from other groups in supporting term limits.
When I ran correlation coefficients on precinct racial concentration vs term limits voting percentage, the only group that had a significant result was Asians. The correlation coefficient of Asian percentage and term limits approval percentage was +0.43, a moderate positive relationship.
So what does that mean? It’s hard to say. As shown above, heavily Asian precincts tend to be located in Upcounty, which elects more moderate candidates and has higher concentrations of Republican and unaffiliated voters than other parts of the county. As we shall see soon, partisanship had a substantial impact on term limits voting. Do Asian voters really prefer term limits or are the moderate politics and greater concentrations of non-Democrats in their precincts responsible for term limits support? Or are they all inter-related? I can’t say more without better data.
Next: we will look at the role of political parties in term limits voting.