By Adam Pagnucco.
Part One outlined the basic financial characteristics of WAMU. Part Two explained how corporate underwriting, WAMU’s second largest revenue source, collapsed after 2019. This was partially replaced by increased contributions of goods and services by WAMU’s owner, American University (AU).
Today, let’s look at WAMU’s costs. Let’s start with the chart below from yesterday showing WAMU’s operating revenues and expenses from FY05 through FY23.
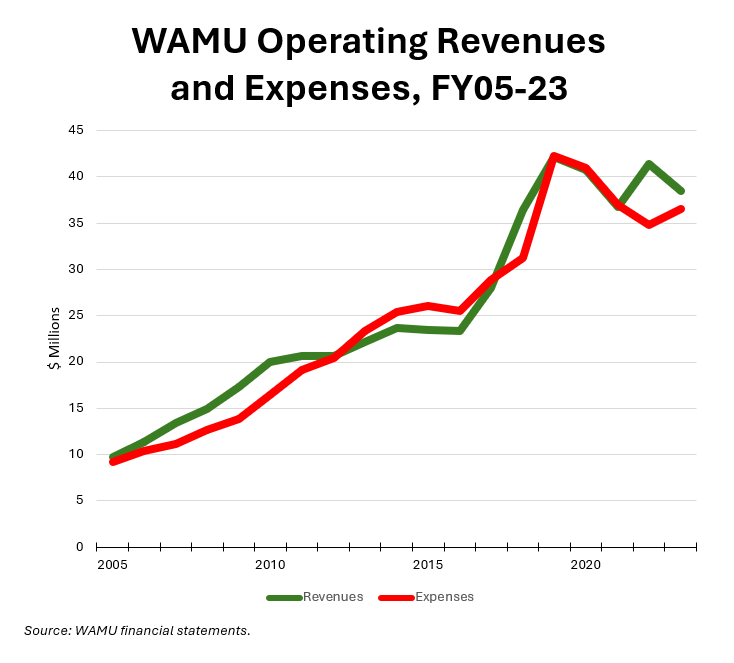
The chart shows that both revenues and expenses peaked in FY19, the year before the pandemic. It’s also notable that the peak occurred exactly one year after WAMU bought DCist, suggesting that any revenue increase associated with the latter did not materialize. We know from Part Two that a calamitous drop in corporate underwriting was responsible for evaporating revenues. What happened to costs?
Costs are presented in two ways: by service type (program services and supporting services) and by object of expenditure. The two are presented in matrix format at the end of each financial report. Let’s start with the two largest objects of expenditure – compensation (salaries, wages and benefits) and production costs – which together accounted for 78% of all expenses in FY23. They are shown from FY05 through FY23 in the chart below.
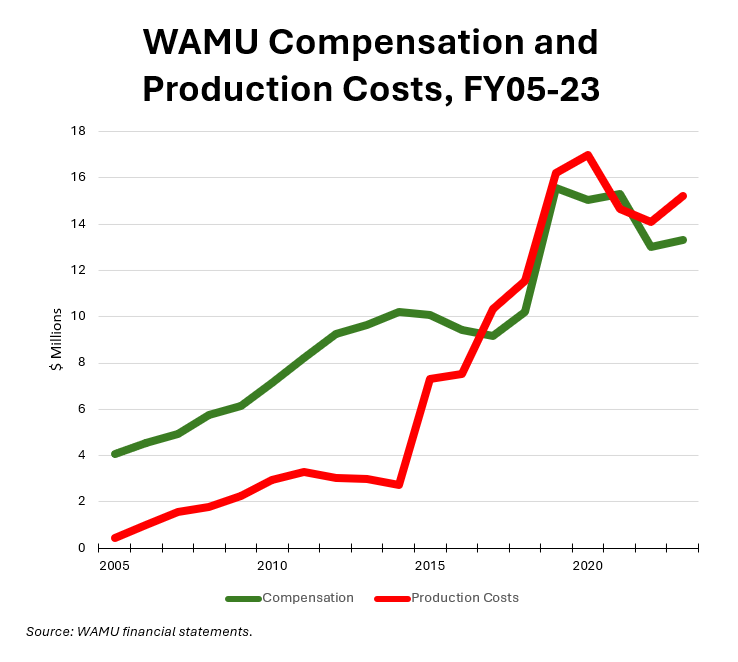
Of the two categories, production costs have grown faster over time and have been cut less since the FY19 peak. From FY19 through FY23, production costs declined by 6% and compensation declined by 15%.
The timing of unionization may be relevant. When WAMU staff formed a union in 2020, the station paid out $15.0 million in compensation, down slightly from the year before. Once the station signed a collective bargaining agreement two years later, compensation was down to $13.0 million. It’s unknown whether the station trimmed positions, cut average salaries and/or benefits, or both. With the collective bargaining agreement in place, compensation rose by 2% in FY23 to $13.3 million.
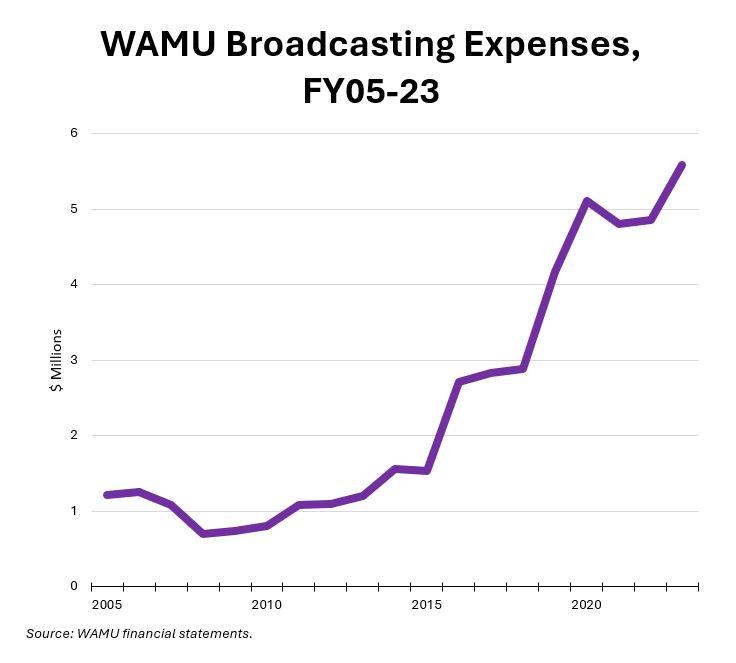
The only major cost that actually went up since FY19 was broadcasting expenses, which is split nearly evenly between compensation and production. While other costs declined from FY19 through FY23, broadcasting costs increased by 34%. The chart below shows how they have changed since FY05, reflecting WAMU’s inability to control them.
Beset by falling revenue, especially corporate underwriting, after the pandemic began, WAMU began cutting its costs. In particular, it aggressively cut compensation costs before signing its first collective bargaining agreement with its union. But some costs, like broadcasting, were harder to control.
We will examine the interaction between revenues and costs in Part Four.